Fig. A.6
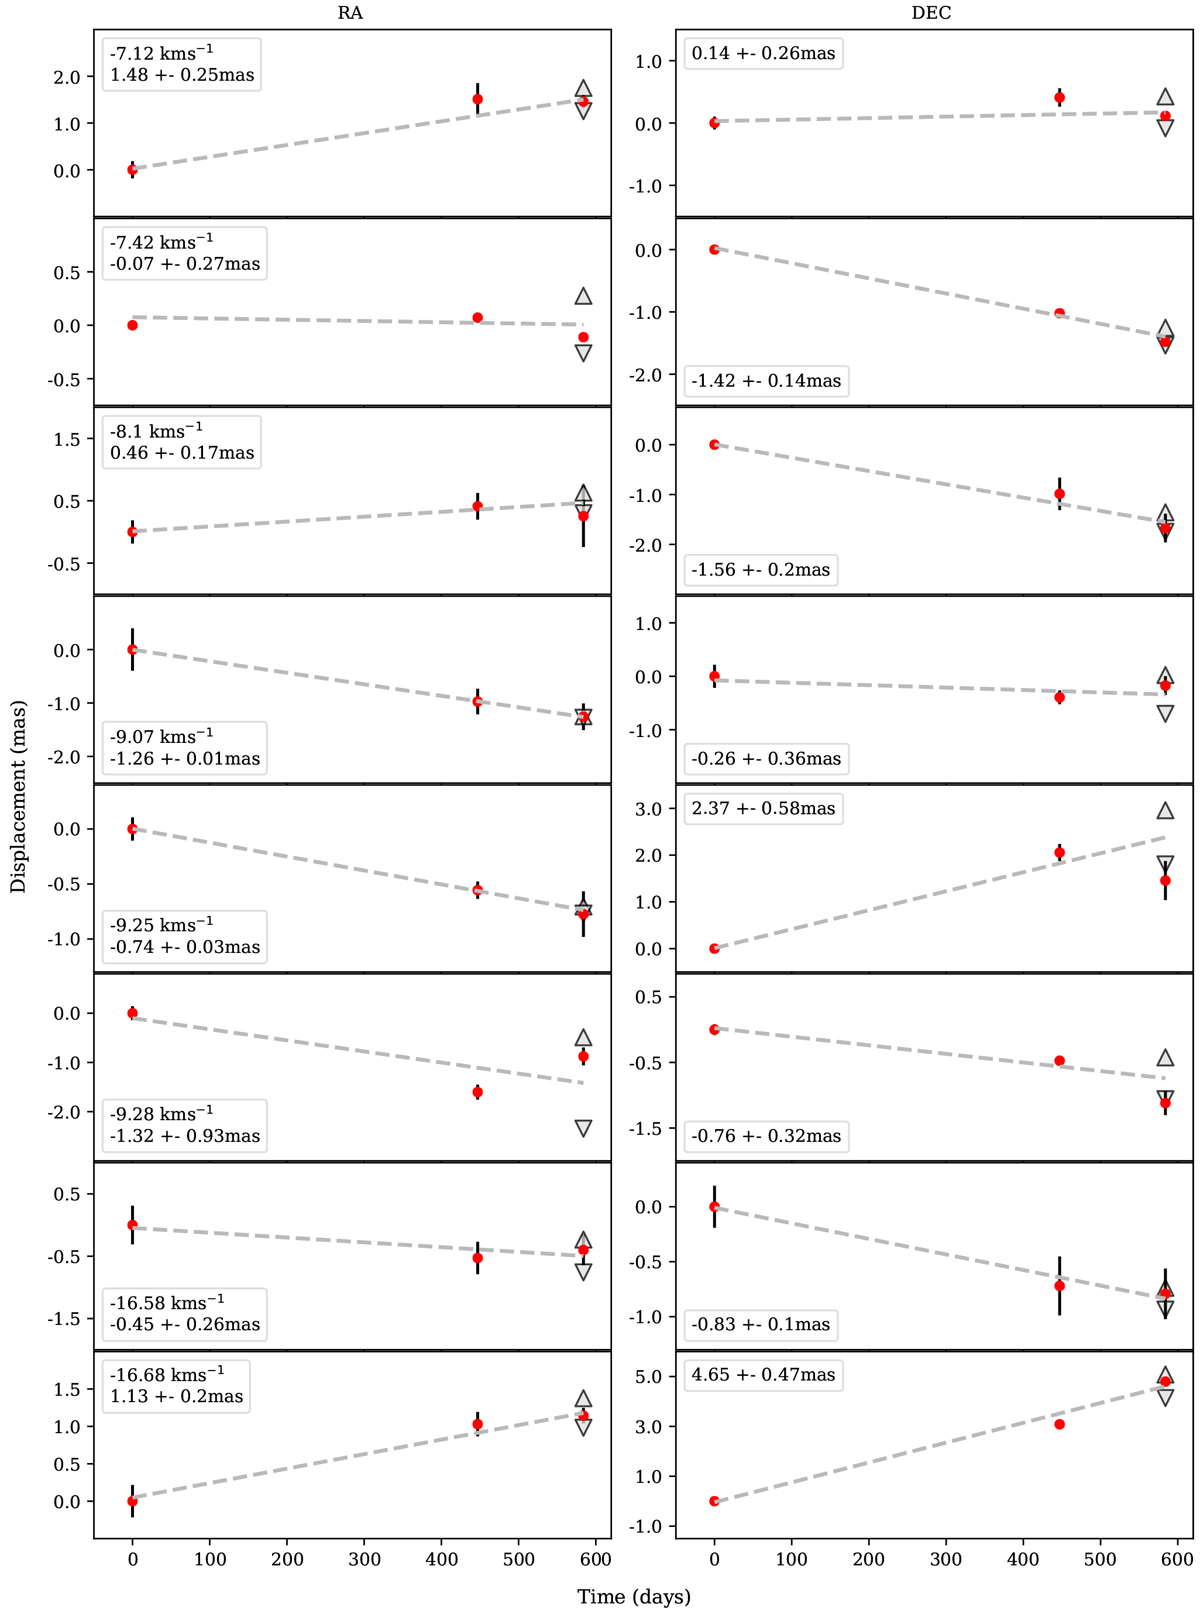
Proper motion measurements vs. time for each cloudlet with RA and Dec components on the left and right panels, respectively.Red points show measured values with respective errors. Dashed lines show best fits of linear functions. Top and bottom triangles show the error range of the fit. The proper motion with estimated errors for each axis is shown in boxes. The velocity of the component concerned is given in the left panel. The final result is shown in Fig. 5.
Current usage metrics show cumulative count of Article Views (full-text article views including HTML views, PDF and ePub downloads, according to the available data) and Abstracts Views on Vision4Press platform.
Data correspond to usage on the plateform after 2015. The current usage metrics is available 48-96 hours after online publication and is updated daily on week days.
Initial download of the metrics may take a while.