Fig. A.5
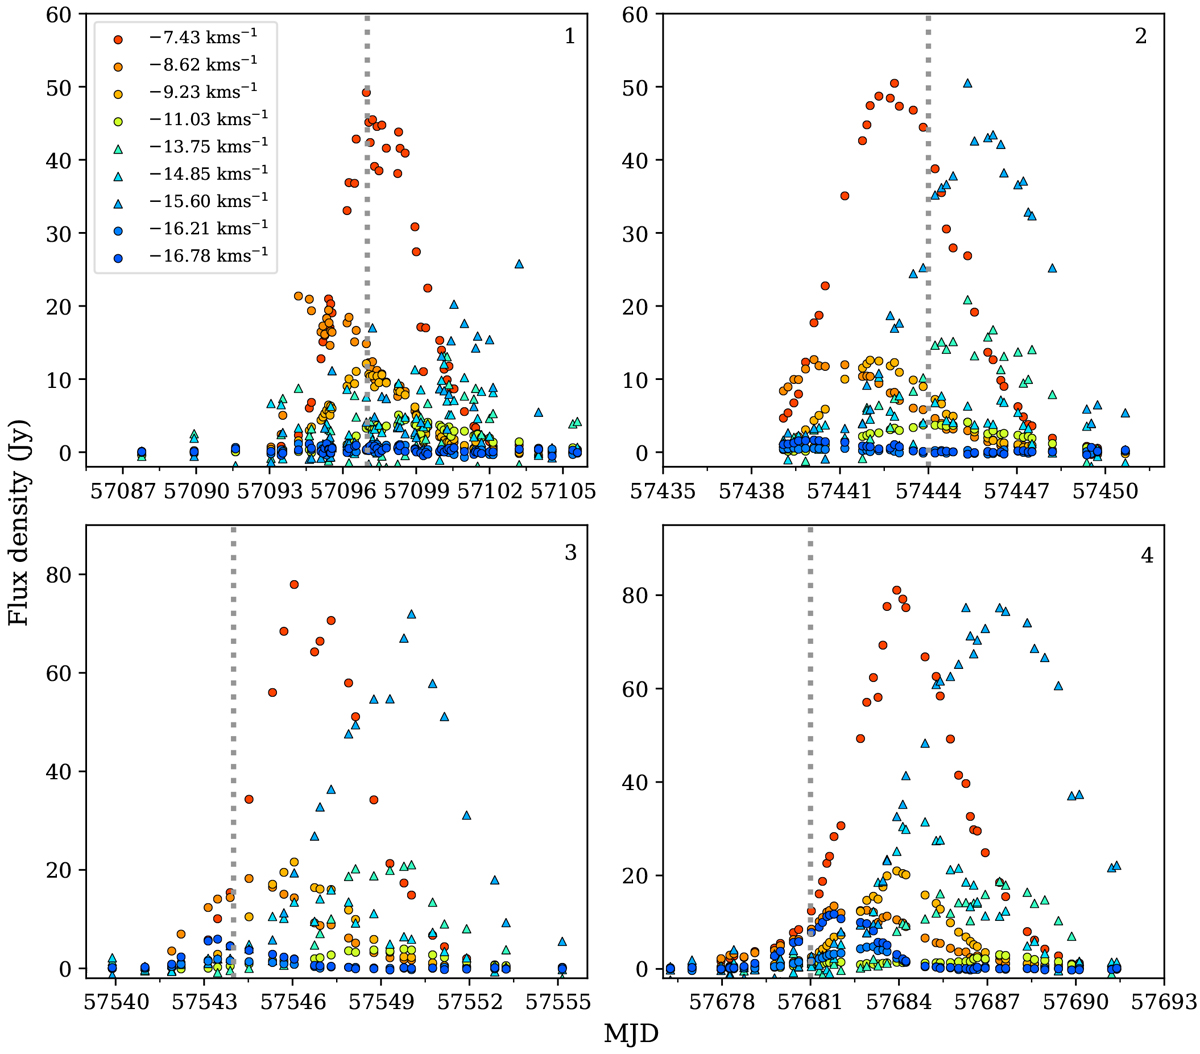
Light curves of 6.7 GHz maser features around the EVN observations. The dotted lines indicates the dates of the EVN experiments numbered in the top right corner. The features in which emission was detected only at the second epoch are denoted by triangles and their flux density was scaled up by a factor of 15. Differences in the maser morphology seen by EVN (Fig. A.4) are clearly related to the flare phase.
Current usage metrics show cumulative count of Article Views (full-text article views including HTML views, PDF and ePub downloads, according to the available data) and Abstracts Views on Vision4Press platform.
Data correspond to usage on the plateform after 2015. The current usage metrics is available 48-96 hours after online publication and is updated daily on week days.
Initial download of the metrics may take a while.