Fig. A.4
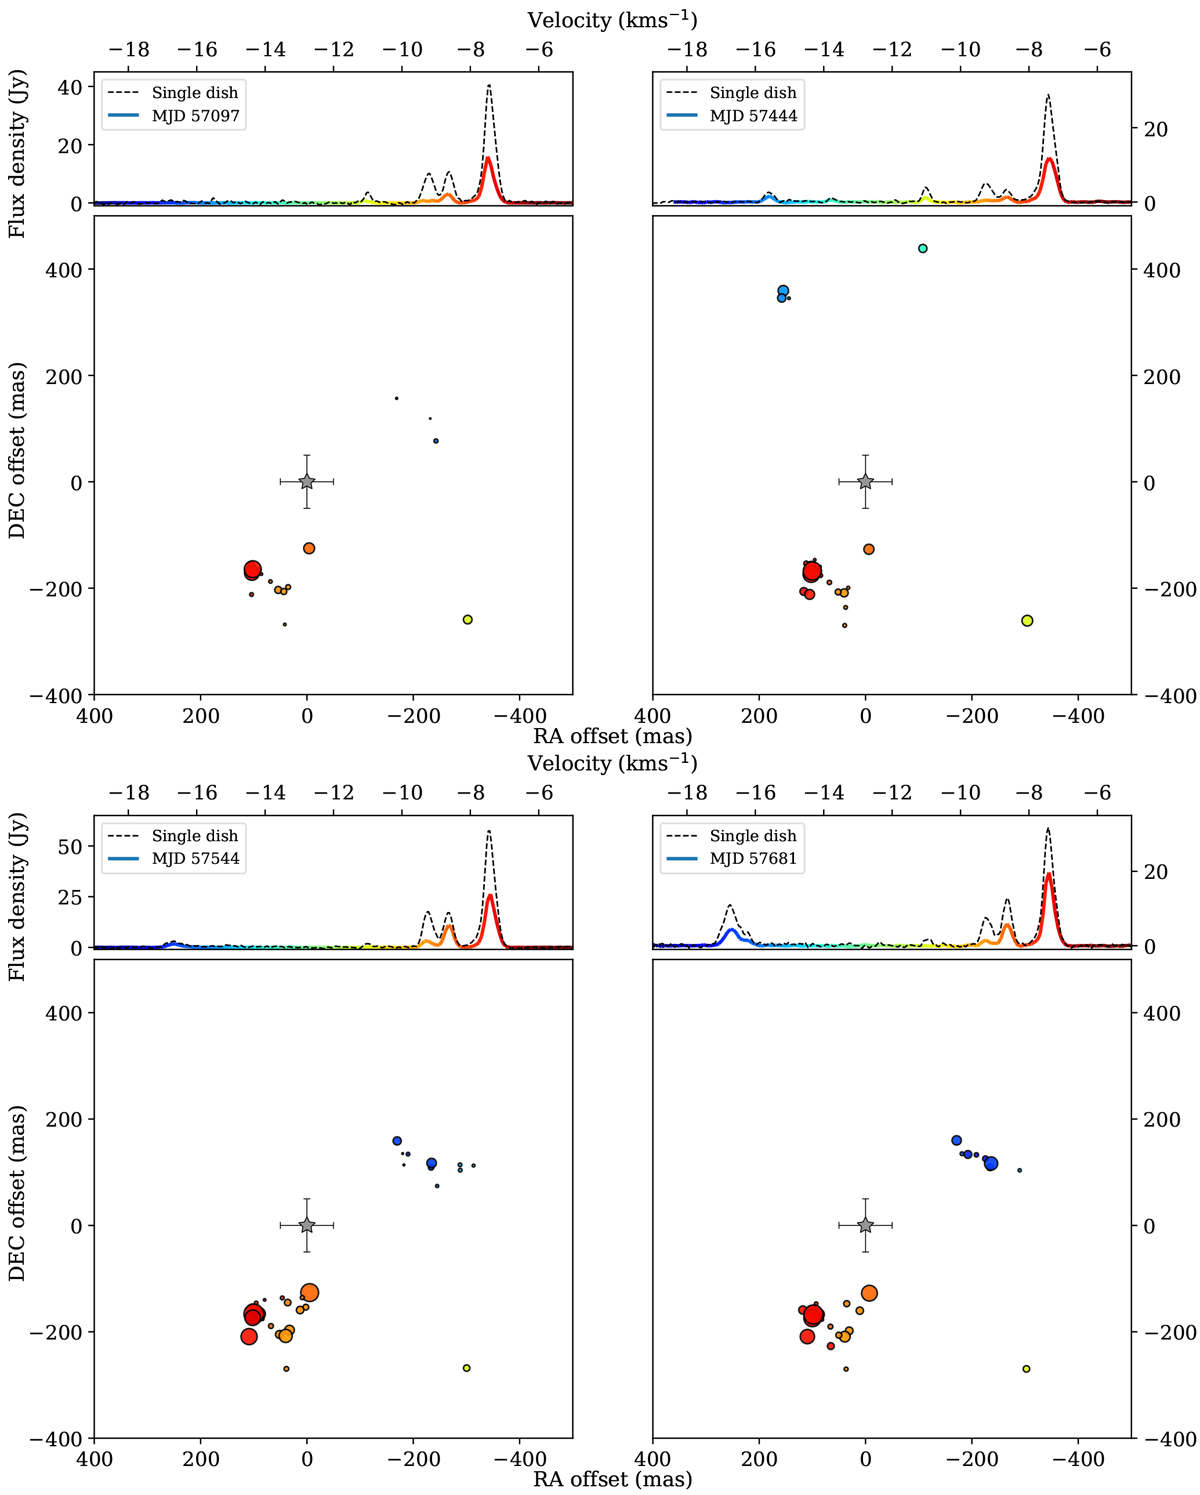
6.7 GHz maser spectra and spatial structures during all epochs of EVN observations. Coloured lines show the cross-correlated VLBI spectra and colour corresponds to velocity of maser cloudlets shown in the bottom panels. The emission is filtered out by the EVN beam by more than 40–60% for most of the spectral features. The size of each circle is scaled with the logarithm of peak flux density. The symbol of grey star with the error bars indicates the position of the 1.3 mm continuum emission peak (Palau et al. 2013).
Current usage metrics show cumulative count of Article Views (full-text article views including HTML views, PDF and ePub downloads, according to the available data) and Abstracts Views on Vision4Press platform.
Data correspond to usage on the plateform after 2015. The current usage metrics is available 48-96 hours after online publication and is updated daily on week days.
Initial download of the metrics may take a while.