Fig. A.1
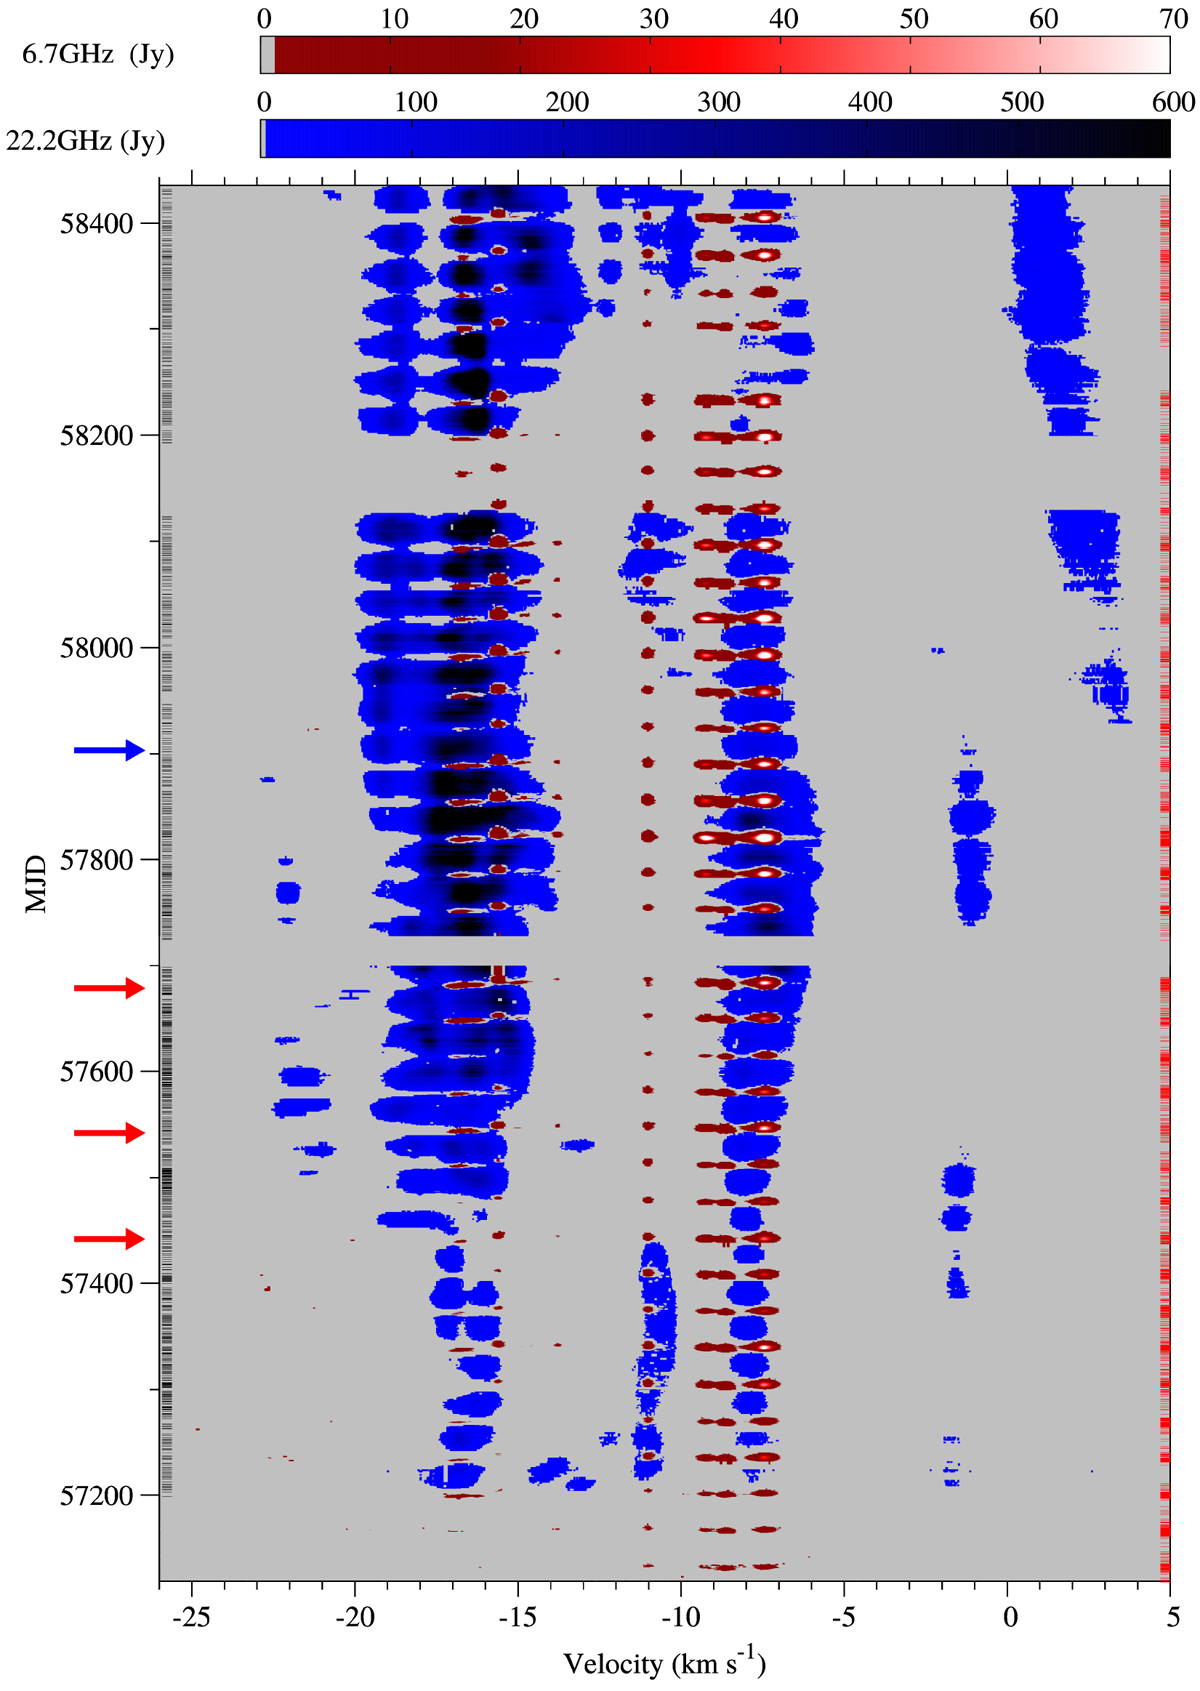
Dynamic spectra of the methanol and water maser lines of G107. Radial velocity is measured with respect to the LSR. The horizontal bars in the left (black) and right (red) ordinates correspond to the dates of the observed spectra of water andmethanol lines, respectively. The red and blue arrows indicate the epochs of VLBI observations of methanol and water, respectively.
Current usage metrics show cumulative count of Article Views (full-text article views including HTML views, PDF and ePub downloads, according to the available data) and Abstracts Views on Vision4Press platform.
Data correspond to usage on the plateform after 2015. The current usage metrics is available 48-96 hours after online publication and is updated daily on week days.
Initial download of the metrics may take a while.