Free Access
Fig. 1
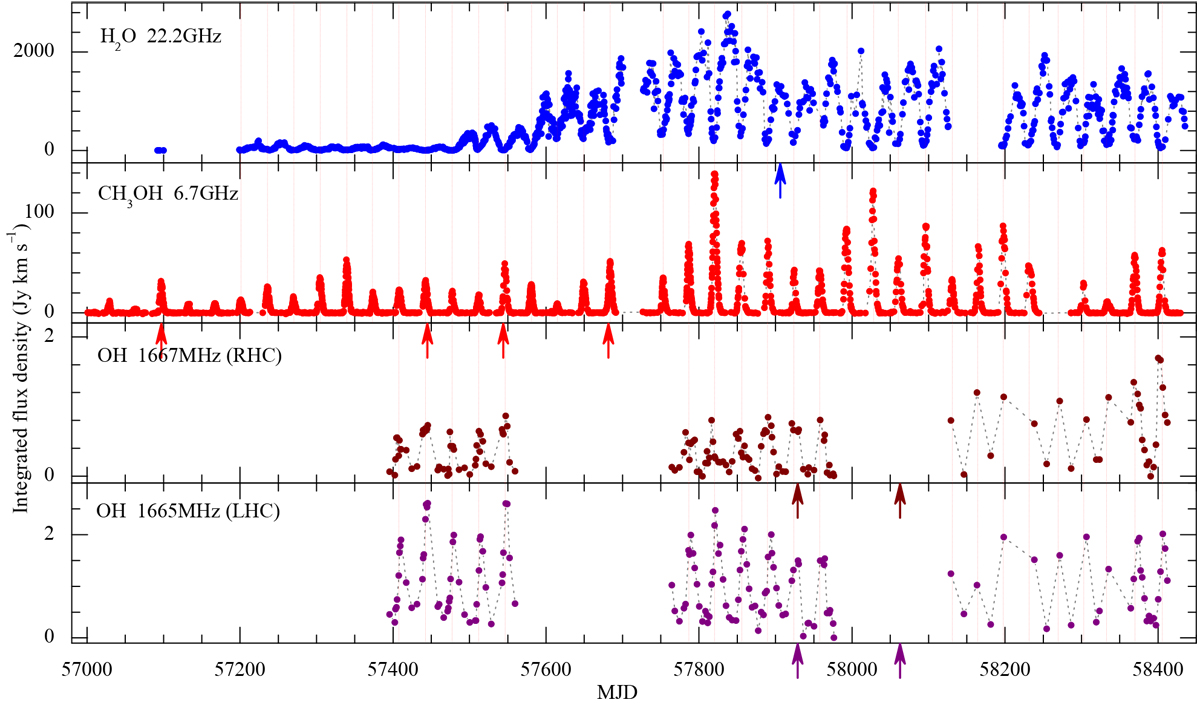
Time series of integrated flux densities in the I Stokes for water vapour and methanol maser transitions and in the RHC and LHC polarisation for hydroxyl maser transitions of G107. The vertical dotted lines indicate the methanol peaks. The arrows below the time axes denote the dates of VLBI observations (Table 1).
Current usage metrics show cumulative count of Article Views (full-text article views including HTML views, PDF and ePub downloads, according to the available data) and Abstracts Views on Vision4Press platform.
Data correspond to usage on the plateform after 2015. The current usage metrics is available 48-96 hours after online publication and is updated daily on week days.
Initial download of the metrics may take a while.