Fig. 7.
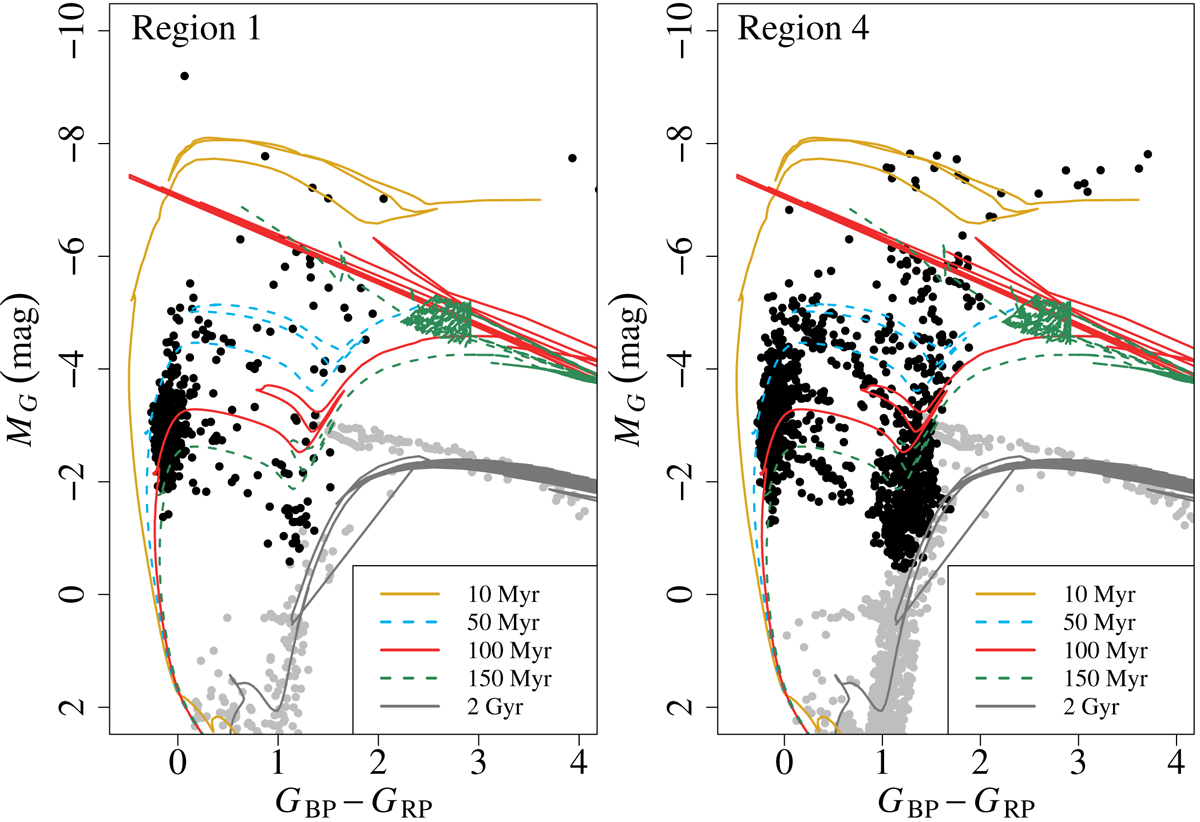
Color–magnitude diagrams for Regions 1 and 4 for Gaia DR2 data, corrected from extinction and reddening and with distance estimated inverting the nominal parallax; for comparison, GALAXIA predictions are shown as gray dots. Shown are (from top to bottom) PARSEC+COLIBRI PR 16 isochrones with solar metallicity of 10 Myr (gold line), 50 Myr (dashed blue line), 100 Myr (solid red line), 150 Myr (dashed green line), and 2 Gyr (solid gray line).
Current usage metrics show cumulative count of Article Views (full-text article views including HTML views, PDF and ePub downloads, according to the available data) and Abstracts Views on Vision4Press platform.
Data correspond to usage on the plateform after 2015. The current usage metrics is available 48-96 hours after online publication and is updated daily on week days.
Initial download of the metrics may take a while.