Free Access
Fig. 6.
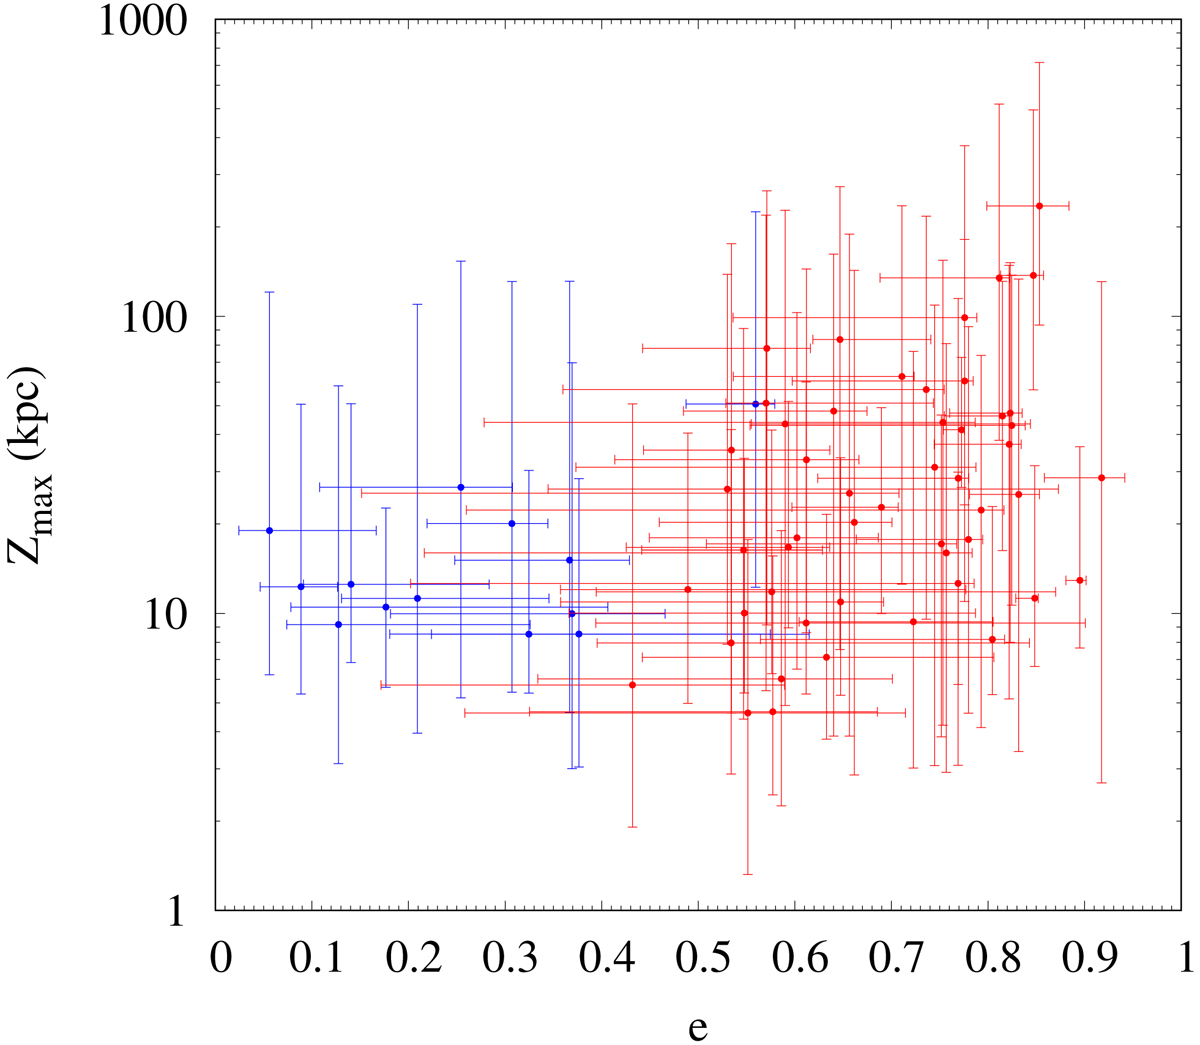
Galactic orbits characteristic of sources in Regions 1 and 4. Maximum height above the plane of the orbit as a function of the eccentricity for relevant sources in Region 1 (13, in blue) and Region 4 (52, in red). Median values and error bars displaying the 16th and 84th percentiles are shown.
Current usage metrics show cumulative count of Article Views (full-text article views including HTML views, PDF and ePub downloads, according to the available data) and Abstracts Views on Vision4Press platform.
Data correspond to usage on the plateform after 2015. The current usage metrics is available 48-96 hours after online publication and is updated daily on week days.
Initial download of the metrics may take a while.