Free Access
Fig. 5.
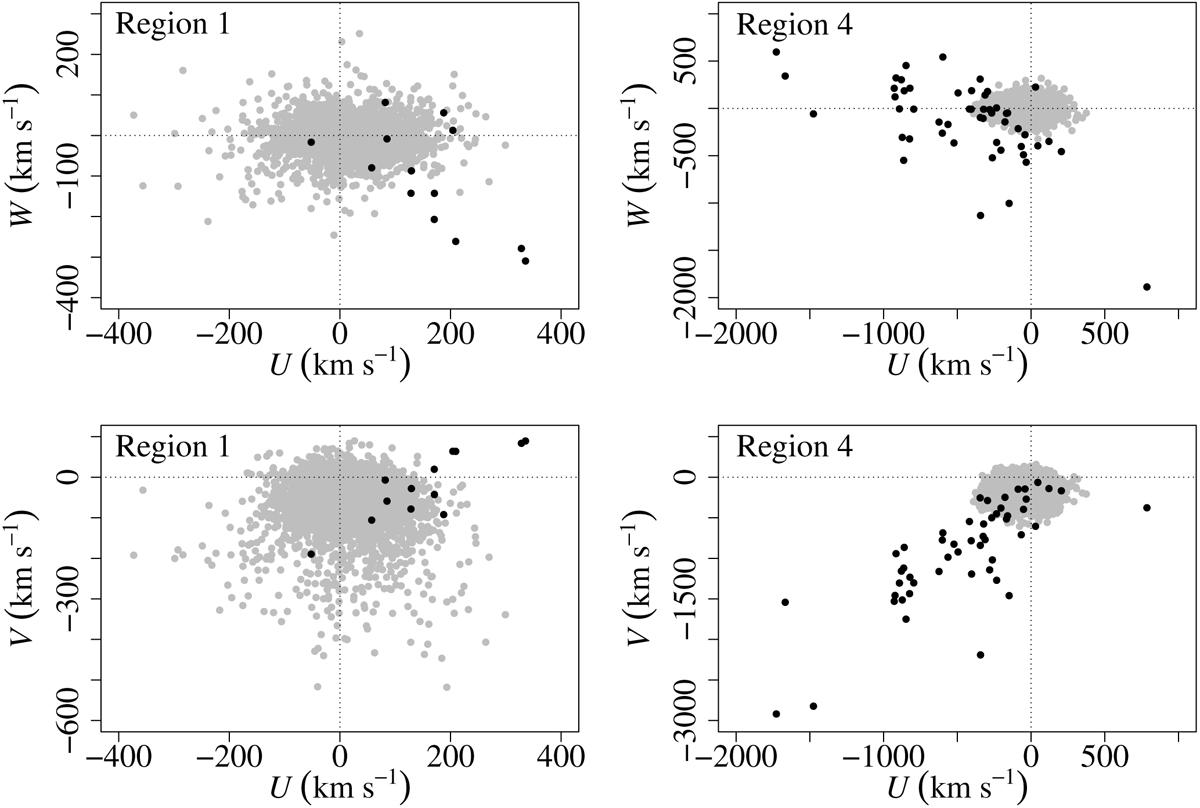
Heliocentric velocities for sources towards Regions 1 and 4. Gray dots are GALAXIA predictions (7065 in Region 1; 26 031 in Region 4), black dots are Gaia DR2 sources with radial velocity data (13 in Region 1; 51 in Region 4).
Current usage metrics show cumulative count of Article Views (full-text article views including HTML views, PDF and ePub downloads, according to the available data) and Abstracts Views on Vision4Press platform.
Data correspond to usage on the plateform after 2015. The current usage metrics is available 48-96 hours after online publication and is updated daily on week days.
Initial download of the metrics may take a while.