Fig. 4.
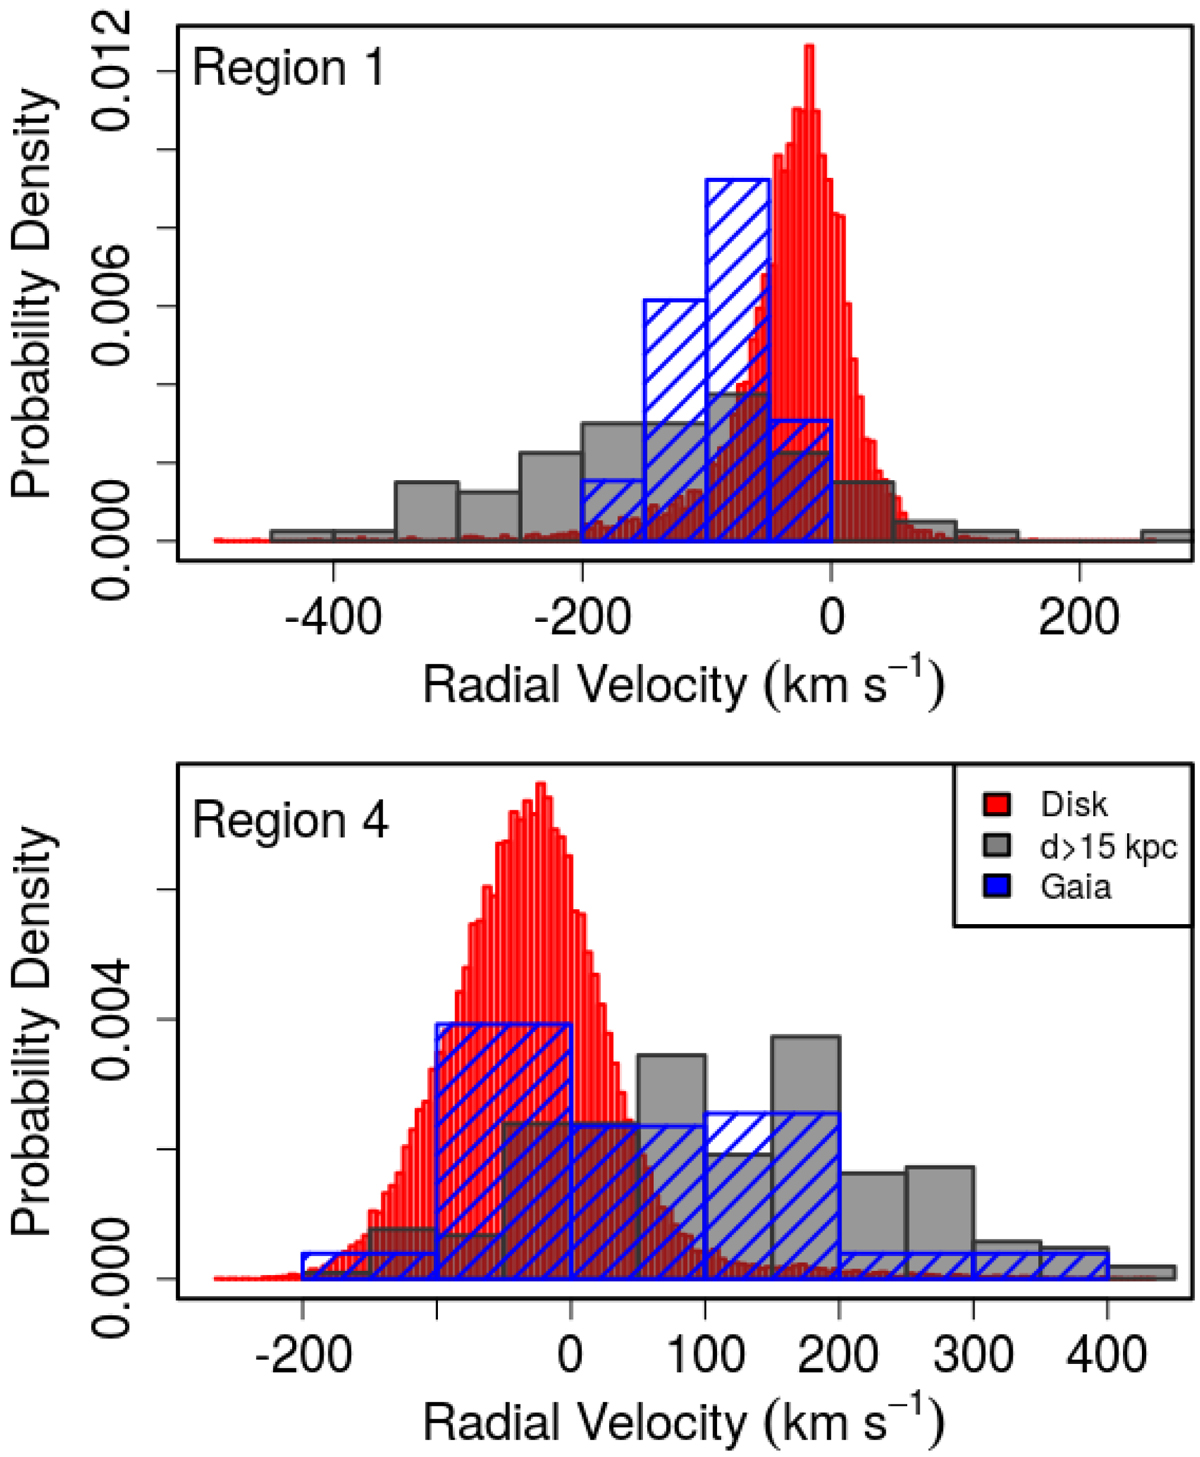
Histogram of radial velocities of sources from Regions 1 and 4. Red bars correspond to GALAXIA predictions for the disk of the Milky Way, while gray bars correspond to predictions for the halo; blue dashed bars correspond to probability densities of Gaia DR2 data (13 sources in Region 1; 51 in Region 4). The probability density is an amount such that the sum of the values times the bin size is equal to 1. Bins were computed according to the Freedman–Diaconis rule.
Current usage metrics show cumulative count of Article Views (full-text article views including HTML views, PDF and ePub downloads, according to the available data) and Abstracts Views on Vision4Press platform.
Data correspond to usage on the plateform after 2015. The current usage metrics is available 48-96 hours after online publication and is updated daily on week days.
Initial download of the metrics may take a while.