Free Access
Fig. 9.
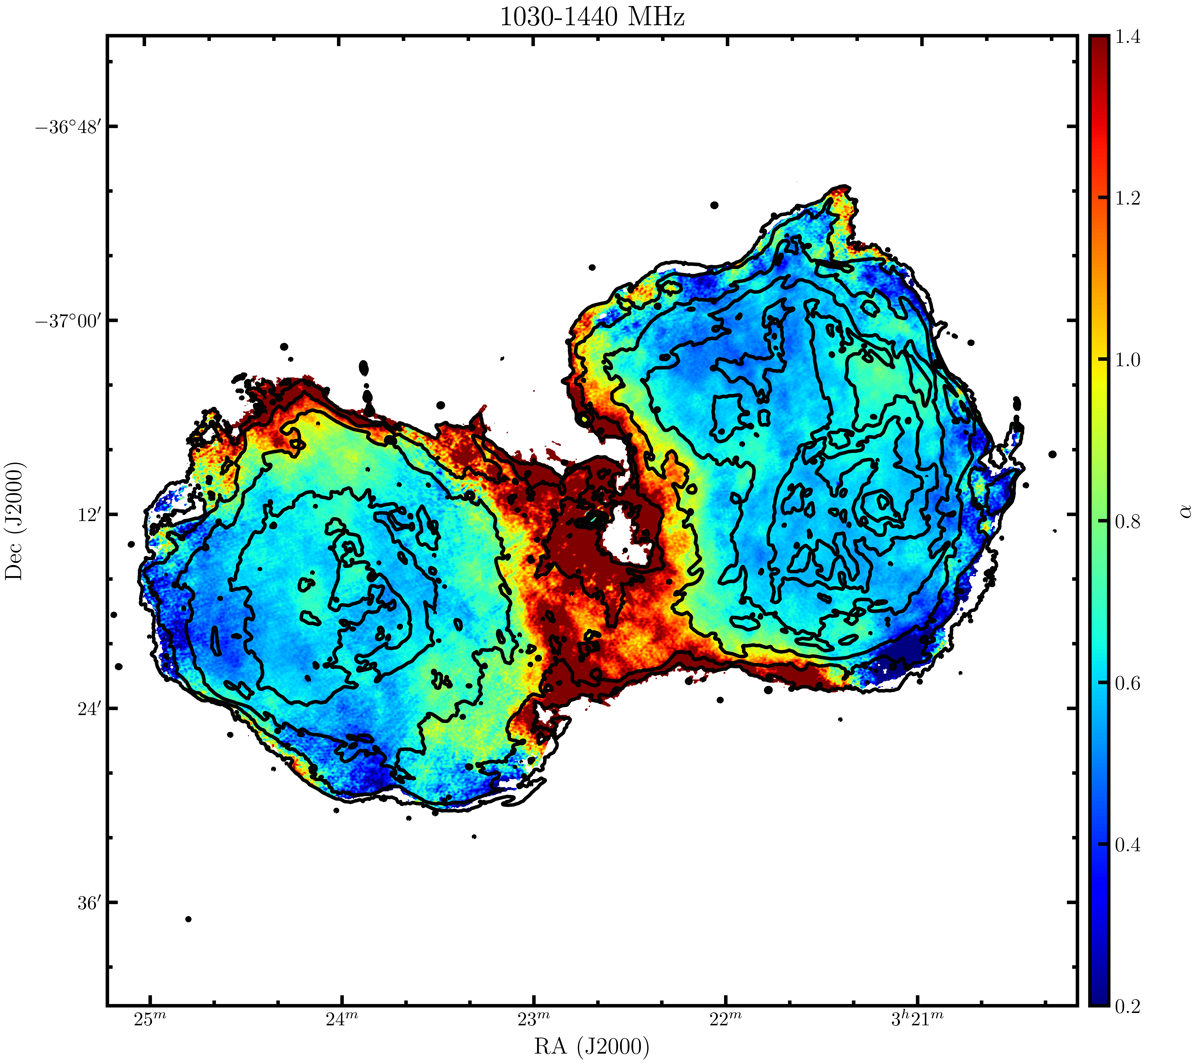
Spectral index map of the radio emission of Fornax A between 1.03 GHz and 1.44 GHz. The resolution of the map is 10″ × 10″. The contour levels show the radio emission at 1.44 GHz. They start at 0.8 mJy beam−1, increasing by a factor of two.
Current usage metrics show cumulative count of Article Views (full-text article views including HTML views, PDF and ePub downloads, according to the available data) and Abstracts Views on Vision4Press platform.
Data correspond to usage on the plateform after 2015. The current usage metrics is available 48-96 hours after online publication and is updated daily on week days.
Initial download of the metrics may take a while.