Fig. 6.
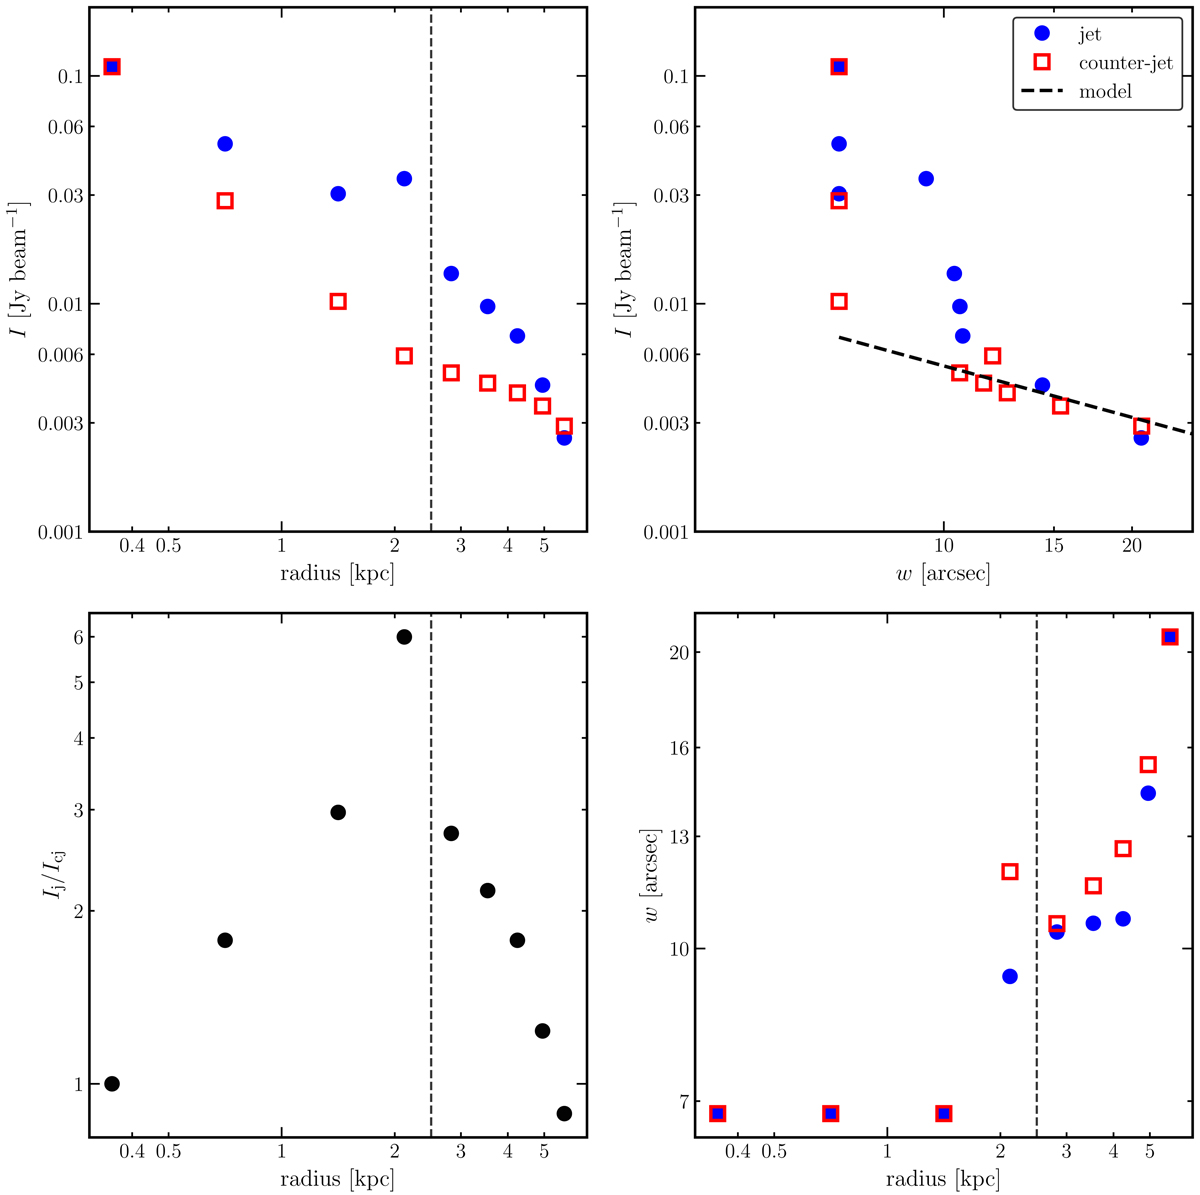
Top left panel: surface brightness vs. radial distance from the core to the jet (blue circles) and counter-jet of Fornax A (red squares). The dashed vertical line marks the radius where the jets bend in the east–west direction. Top right panel: surface brightness of the jet and counter-jet vs. transverse size. The dashed line shows the predicted distribution if the jets were adiabatically expanding. Bottom left panel: surface brightness ratio between jet and counter-jet vs. radial distance from the core. Bottom right panel: transverse size of the jet and counter-jet vs. radial distance from the core. Colours are as in the top panels.
Current usage metrics show cumulative count of Article Views (full-text article views including HTML views, PDF and ePub downloads, according to the available data) and Abstracts Views on Vision4Press platform.
Data correspond to usage on the plateform after 2015. The current usage metrics is available 48-96 hours after online publication and is updated daily on week days.
Initial download of the metrics may take a while.