Fig. 4.
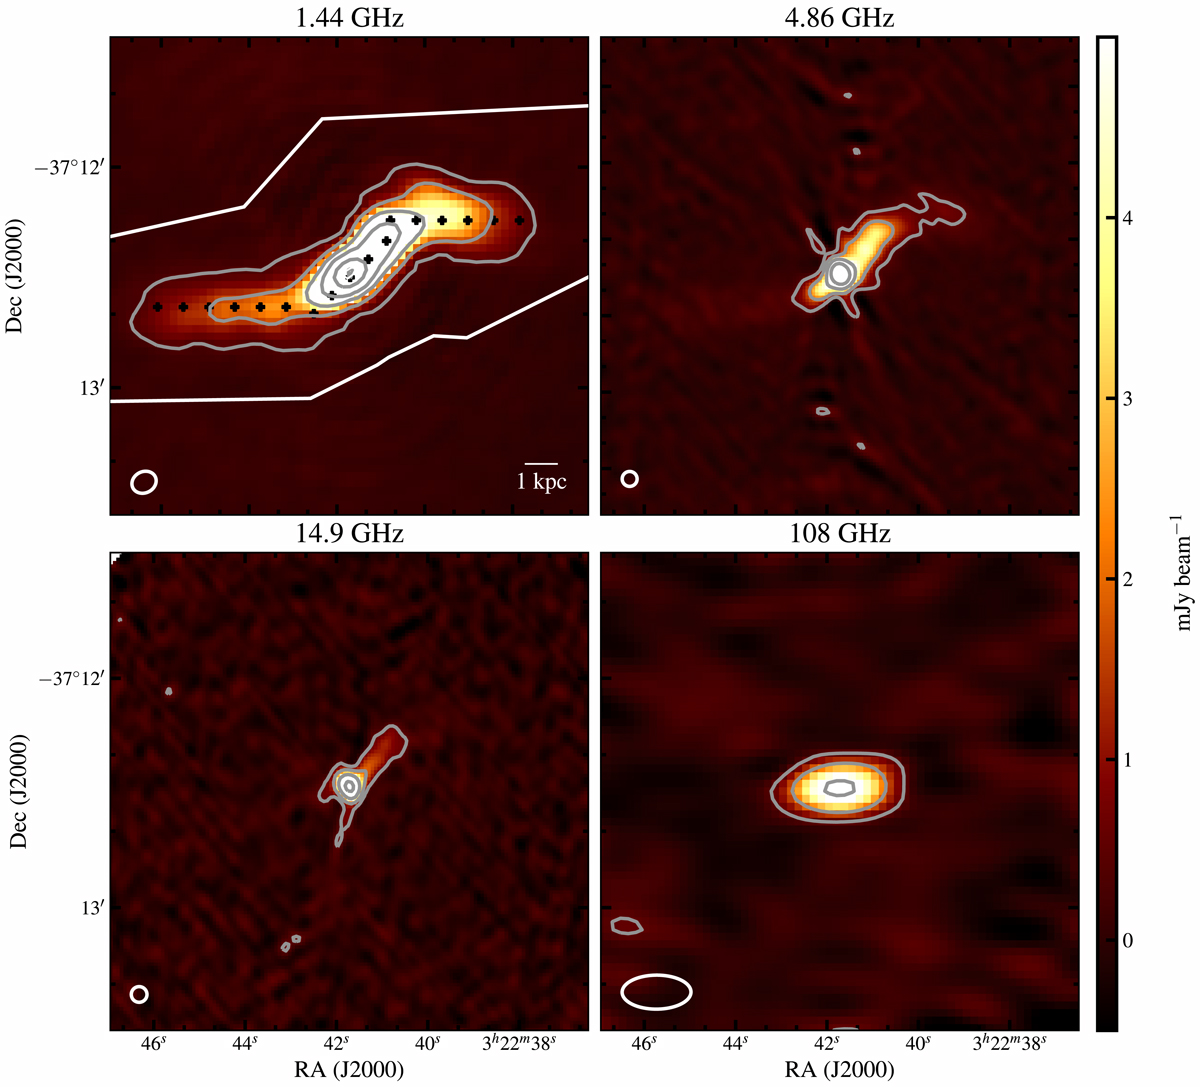
Central emission of Fornax A seen at 1.44 GHz by MeerKAT (top left panel), at 4.86 GHz (top right panel), 14.9 GHz (bottom left panel) by the VLA and at 108 GHz (bottom right panel) by ALMA. The PSF of the images is shown in white in the bottom left corner. Contour levels start at 0.6 mJy beam−1, increasing by factors of three. In the top left panel, the black dots show where we measured the variations in flux density and width along the jets (see Sect. 4 for further details).
Current usage metrics show cumulative count of Article Views (full-text article views including HTML views, PDF and ePub downloads, according to the available data) and Abstracts Views on Vision4Press platform.
Data correspond to usage on the plateform after 2015. The current usage metrics is available 48-96 hours after online publication and is updated daily on week days.
Initial download of the metrics may take a while.