Fig. B.1.
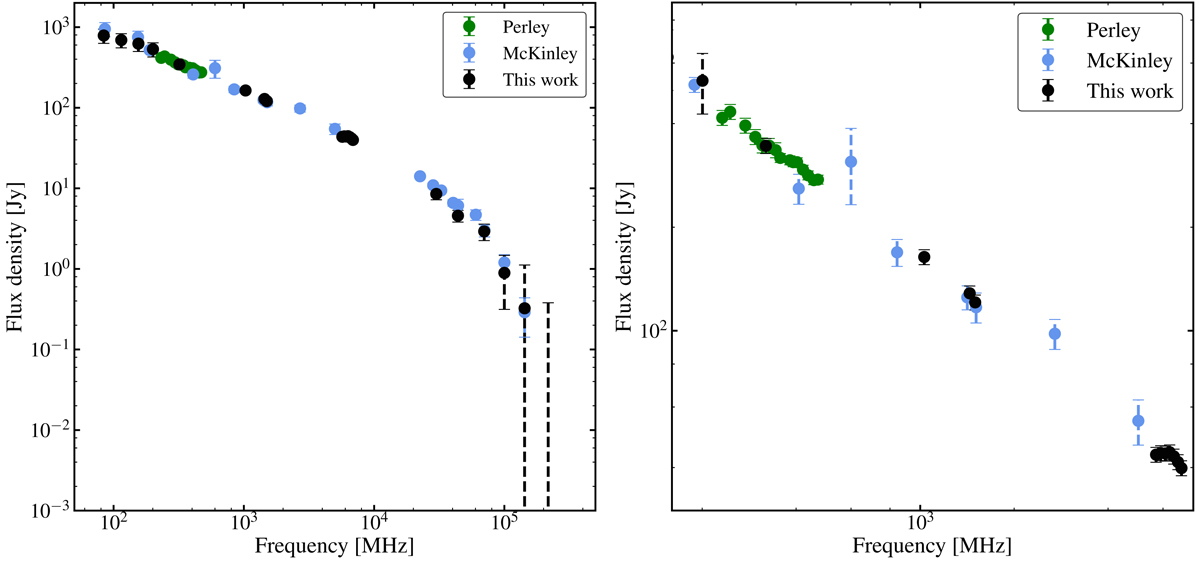
Left panel: total flux density distribution of Fornax A between 84 MHz and 217 GHz measured in this work (black), between 4.7 MHz and 143 GHz by McKinley et al. (2015) (blue) and between 232 MHz and 470 MHz by Perley & Butler (2017) (green). Right panel: zoom of the left panel between 200 MHz and 7 GHz, the bandwidth used to make the spectral index maps discussed in Sect. 5.1.
Current usage metrics show cumulative count of Article Views (full-text article views including HTML views, PDF and ePub downloads, according to the available data) and Abstracts Views on Vision4Press platform.
Data correspond to usage on the plateform after 2015. The current usage metrics is available 48-96 hours after online publication and is updated daily on week days.
Initial download of the metrics may take a while.