Fig. A.3.
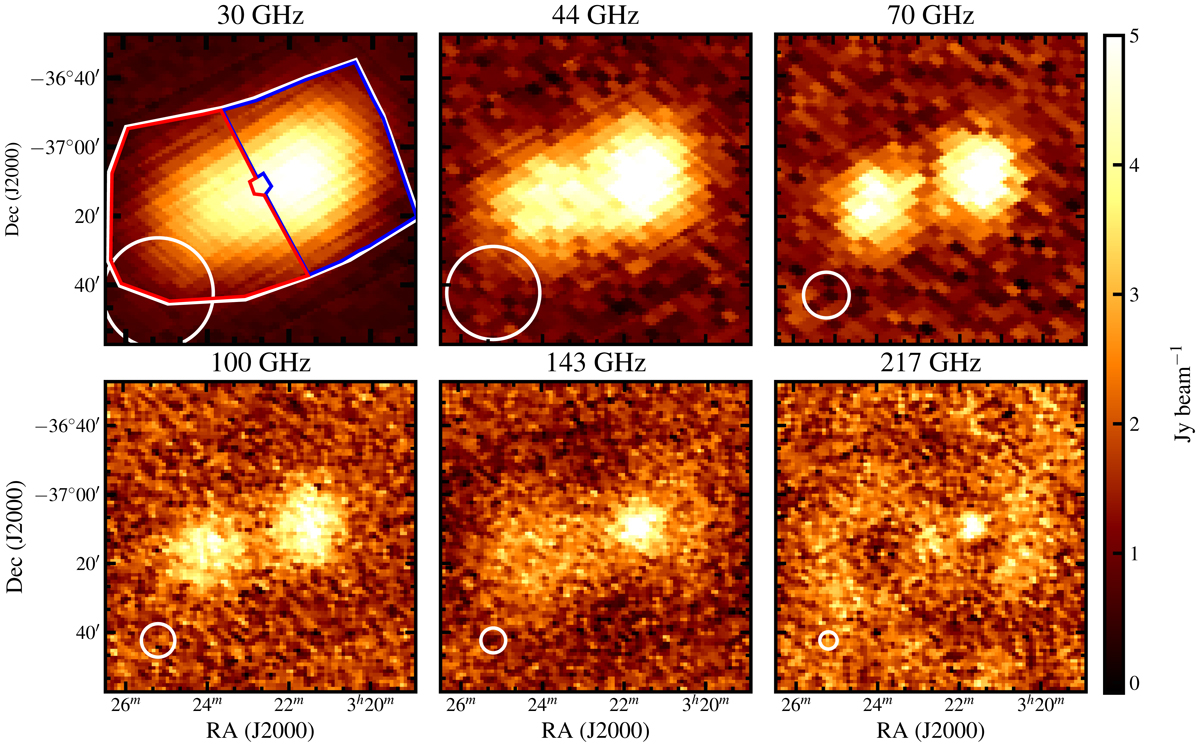
Fornax A seen by the Planck LFI at 30, 44 and 70 GHz, and by Planck HFI at 100, 144 and 217 GHz. At 217 GHz the lobes of Fornax A are undetected. The colour-scale is the same in all panels. The PSF of the images is shown in white in the bottom left corner. The blue and red regions in the top left panel indicate where we measure the flux density of the east and west lobes.
Current usage metrics show cumulative count of Article Views (full-text article views including HTML views, PDF and ePub downloads, according to the available data) and Abstracts Views on Vision4Press platform.
Data correspond to usage on the plateform after 2015. The current usage metrics is available 48-96 hours after online publication and is updated daily on week days.
Initial download of the metrics may take a while.