Free Access
Fig. A.2.
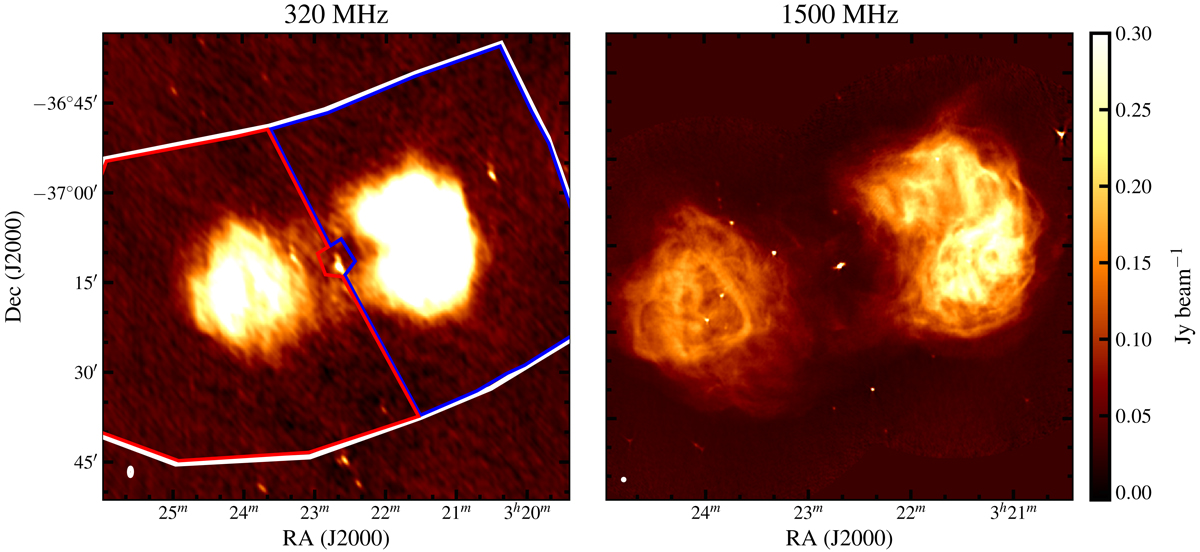
Fornax A seen by the VLA at 320 MHz and 1500 MHz. The colour-scale is the same in both panels. As in the previous figures, the regions in the left panel show where we measure the flux density of the radio lobes. The PSF of the images is shown in white in the bottom left corner.
Current usage metrics show cumulative count of Article Views (full-text article views including HTML views, PDF and ePub downloads, according to the available data) and Abstracts Views on Vision4Press platform.
Data correspond to usage on the plateform after 2015. The current usage metrics is available 48-96 hours after online publication and is updated daily on week days.
Initial download of the metrics may take a while.