Fig. A.1.
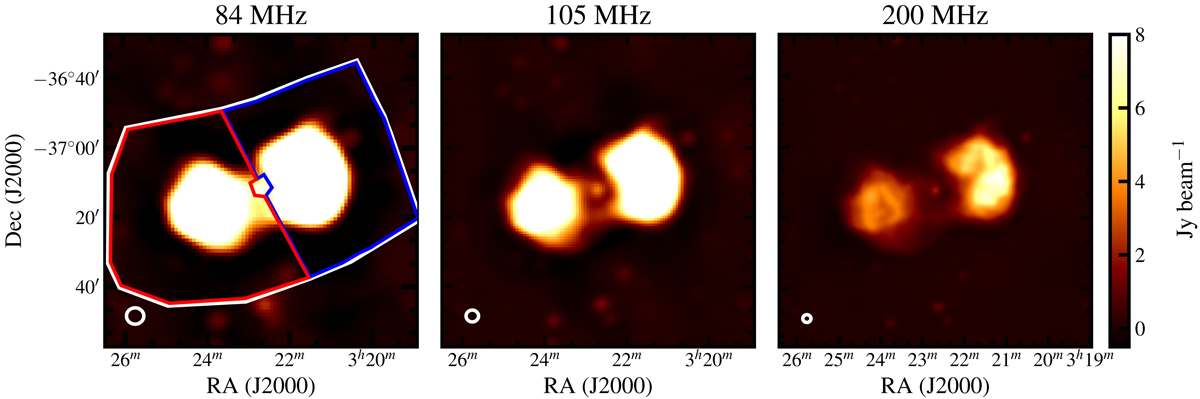
Fornax A seen by the MWA between 70 MHz and 230 MHz. The colour-scale is the same in all panels. In the left panel, the white contours mark the region where we measure the total flux of the source, the red and blue contours show the regions of the east and west lobes. The PSF of the images is shown in white in the bottom left corner.
Current usage metrics show cumulative count of Article Views (full-text article views including HTML views, PDF and ePub downloads, according to the available data) and Abstracts Views on Vision4Press platform.
Data correspond to usage on the plateform after 2015. The current usage metrics is available 48-96 hours after online publication and is updated daily on week days.
Initial download of the metrics may take a while.