Fig. 15.
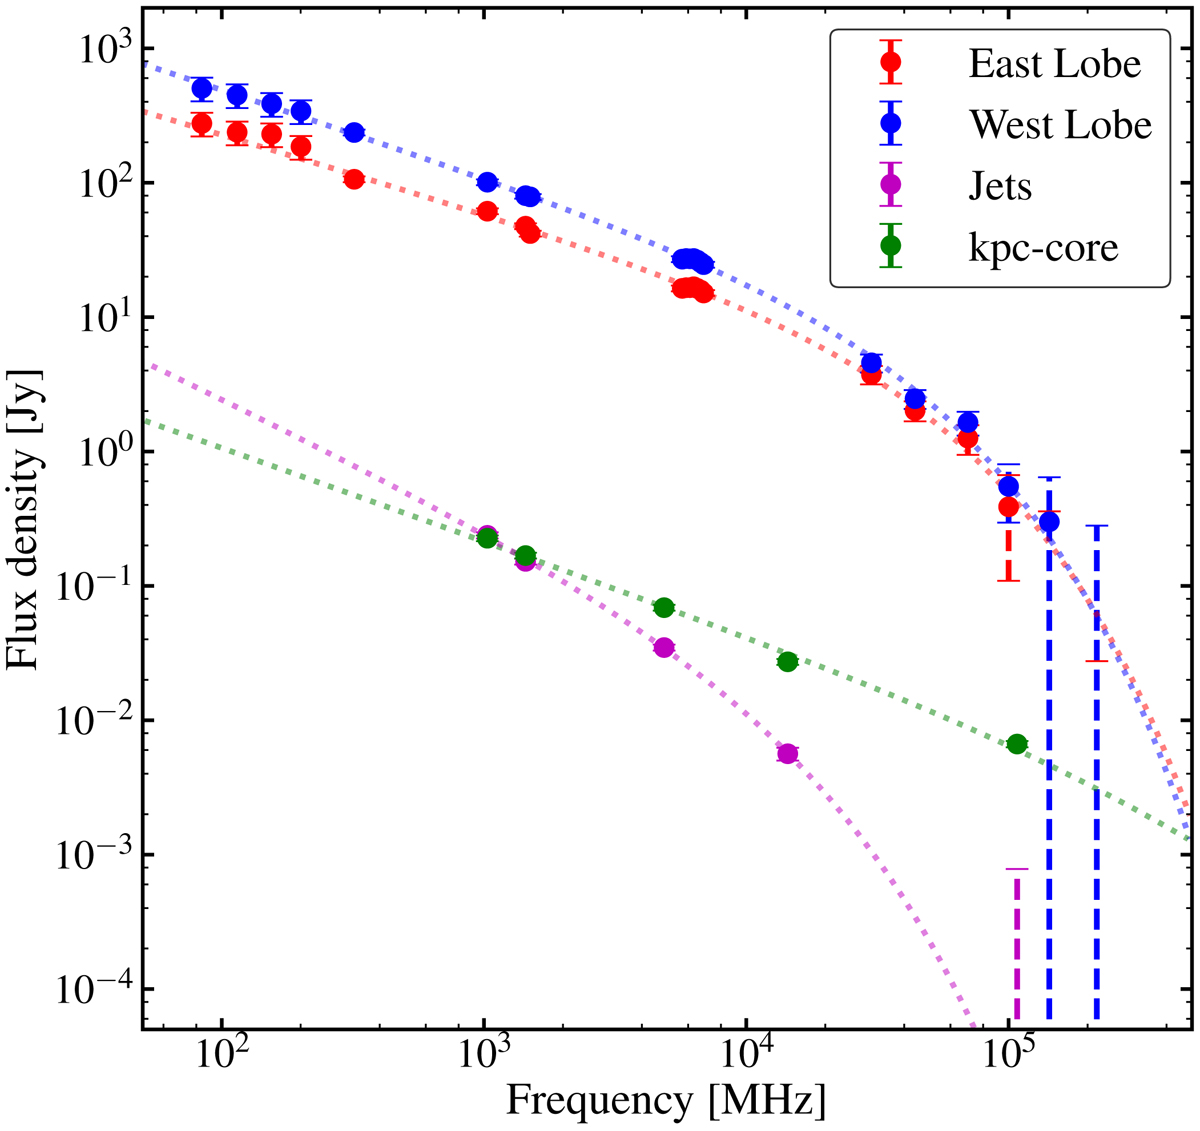
Radio spectrum of the different components of Fornax A. The east lobe is shown in red, the west lobe in blue. The jets and kpc-core are in magenta and green, respectively. The dashed lines show the model of injection that best fits the flux distributions. The spectral shape of the lobes is very different from that of the inner components.
Current usage metrics show cumulative count of Article Views (full-text article views including HTML views, PDF and ePub downloads, according to the available data) and Abstracts Views on Vision4Press platform.
Data correspond to usage on the plateform after 2015. The current usage metrics is available 48-96 hours after online publication and is updated daily on week days.
Initial download of the metrics may take a while.