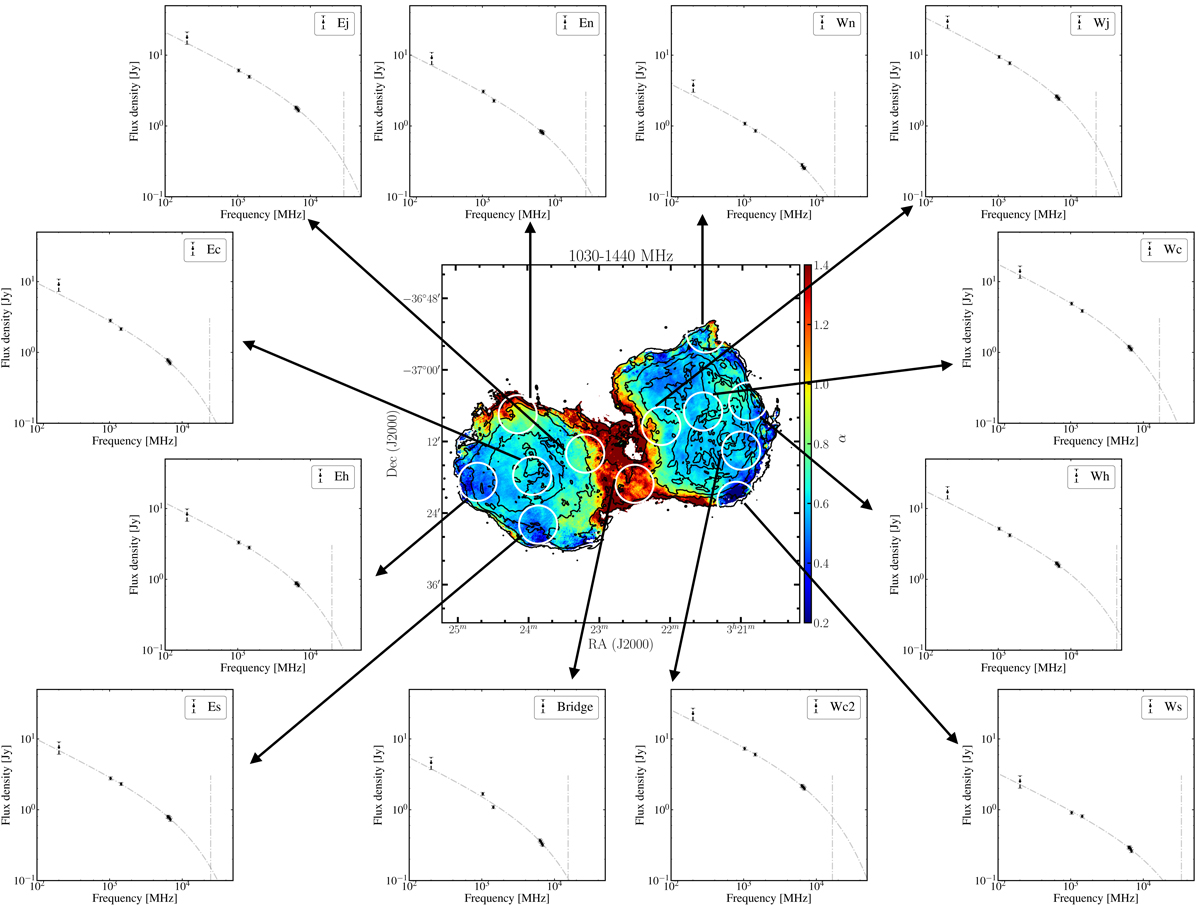
Fig. 11.

Spectral index map of the radio emission of Fornax A. The white circles mark the regions where we analyse the spectral differences within the lobes. The panels show the best fit JP model for the spectra of each region (further details are given in Sect. 6). Regions at the edge of the lobes have a higher break frequency than the bridge and the inner regions.
Current usage metrics show cumulative count of Article Views (full-text article views including HTML views, PDF and ePub downloads, according to the available data) and Abstracts Views on Vision4Press platform.
Data correspond to usage on the plateform after 2015. The current usage metrics is available 48-96 hours after online publication and is updated daily on week days.
Initial download of the metrics may take a while.


