Fig. 10.
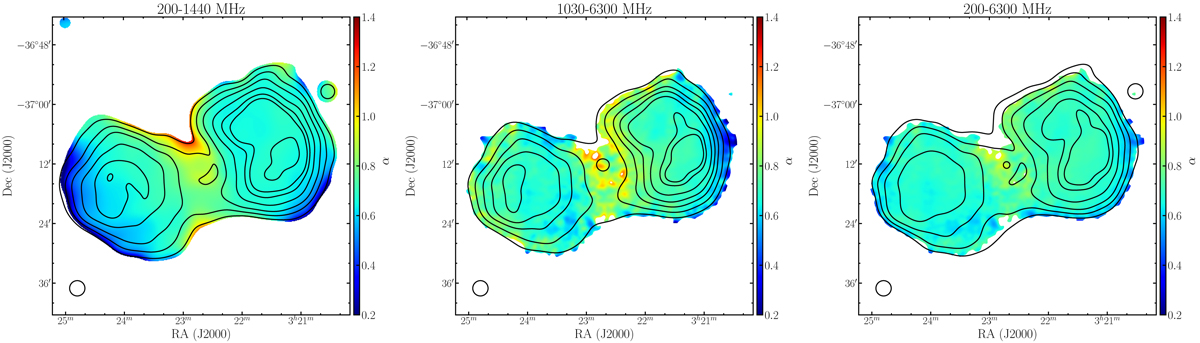
Left panel: spectral index map of Fornax A between 200 MHz and 1.44 GHz (extracted from MWA and MeerKAT observations). The resolution is the same in all images (3′×3′) and is shown in black in the bottom left corner. The colour scale is the same as in Fig. 9. The contour levels show the radio emission at 1.44 GHz. Contours start at 0.1 mJy beam−1, increasing by a factor of two. Central panel: spectral index map between 1.03 GHz and 6.30 GHz (taken from MeerKAT and SRT observations). The colour-scale of the map is the same as in the left panel. The contour levels show the radio emission at 1.03 GHz, starting at 0.2 mJy beam−1, increasing by a factor of two. Right panel: spectral index map between 200 MHz and 6.3 GHz (from MWA and SRT observations). The PSF and colour-scale of the map are the same as in the top left panel. The contour levels show the radio emission at 200 MHz, starting at 0.5 mJy beam−1, increasing by a factor of two.
Current usage metrics show cumulative count of Article Views (full-text article views including HTML views, PDF and ePub downloads, according to the available data) and Abstracts Views on Vision4Press platform.
Data correspond to usage on the plateform after 2015. The current usage metrics is available 48-96 hours after online publication and is updated daily on week days.
Initial download of the metrics may take a while.