Free Access
Fig. 9.
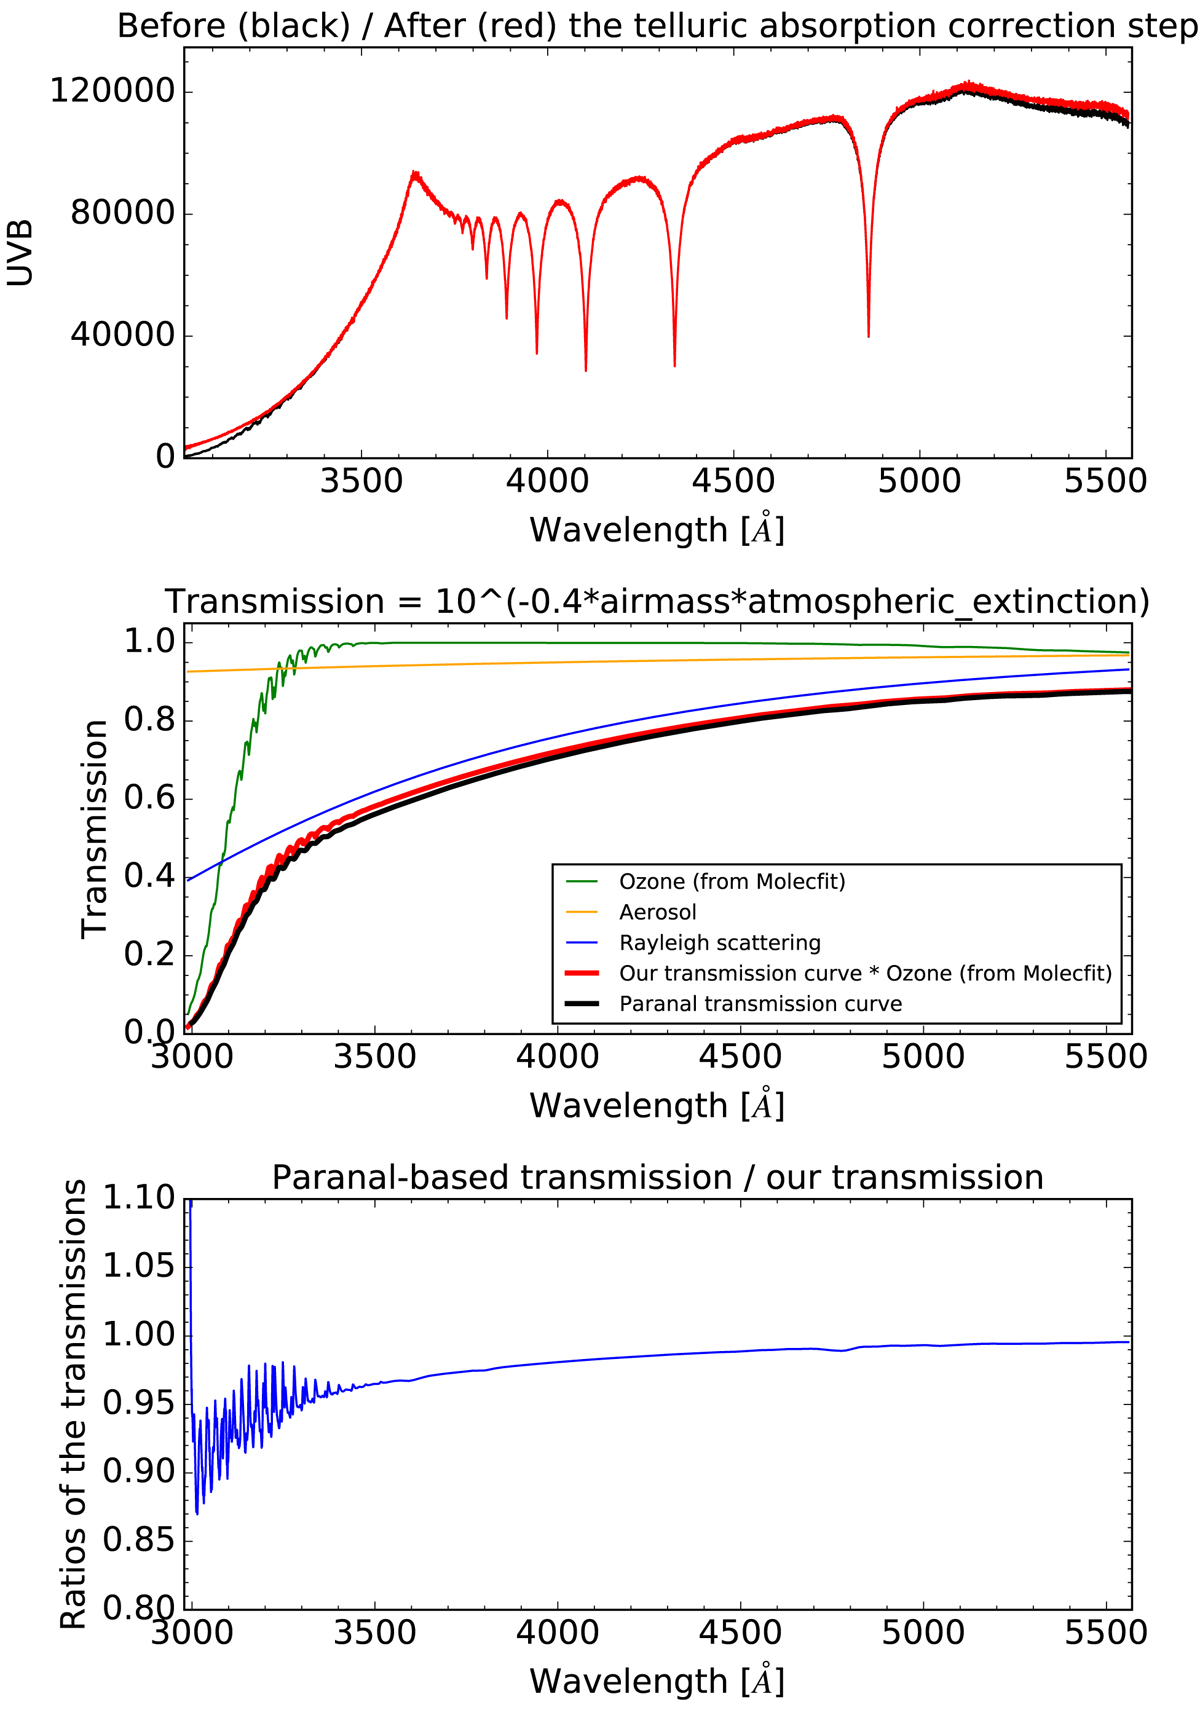
Top: UVB flux-standard spectrum (related to X0365) corrected for O3 with Molecfit (red spectrum), compared to an uncorrected one (black spectrum). Middle: our own transmission curve (red curve) – with the details of its three components – compared to the pipeline one (black curve). Bottom: ratios of the transmissions.
Current usage metrics show cumulative count of Article Views (full-text article views including HTML views, PDF and ePub downloads, according to the available data) and Abstracts Views on Vision4Press platform.
Data correspond to usage on the plateform after 2015. The current usage metrics is available 48-96 hours after online publication and is updated daily on week days.
Initial download of the metrics may take a while.