Fig. 12.
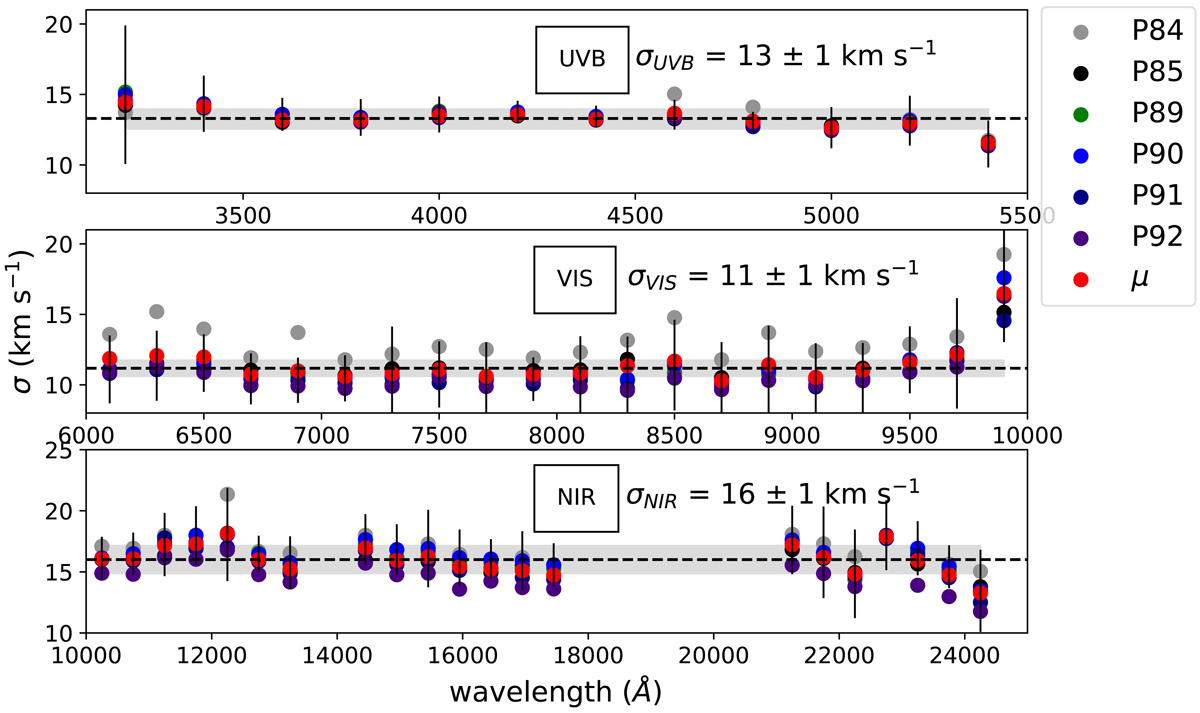
Spectral resolution wavelength dependence for each observing periods. Gray, black, green, blue, dark blue and indigo markers show the medians of measurements of data from observing periods “P84”, “P85”, “P89”, “P90”, “P91” and “P92” respectively. The red point shows the weighted average of all observing periods. The error bars belong to period P90 measurements and are shown for illustrative purposes.
Current usage metrics show cumulative count of Article Views (full-text article views including HTML views, PDF and ePub downloads, according to the available data) and Abstracts Views on Vision4Press platform.
Data correspond to usage on the plateform after 2015. The current usage metrics is available 48-96 hours after online publication and is updated daily on week days.
Initial download of the metrics may take a while.