Fig. A.2
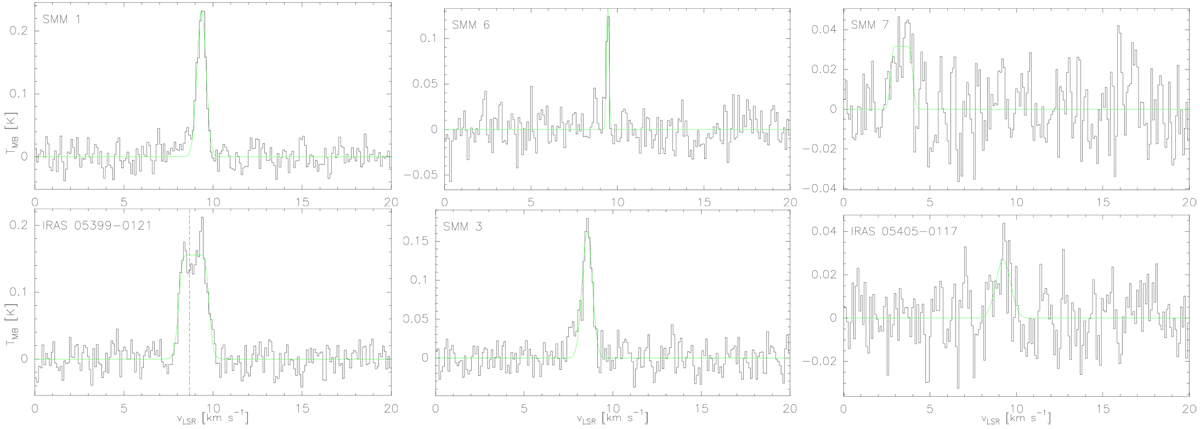
APEX DCO+(5−4) spectra towards the prestellar cores (top row) and protostellar cores (bottom row) in our sample. Hyperfine structure fits to the lines are overlaid in green. While the velocity range shown in each panel is the same, the intensity range is different to better show the line profiles. A double-peaked profile with a stronger red peak is detected towards IRAS 05399. The red, vertical dashed line in the IRAS 05399 panel shows the systemic velocity derived from C17O(2−1) by Miettinen et al. (2012).
Current usage metrics show cumulative count of Article Views (full-text article views including HTML views, PDF and ePub downloads, according to the available data) and Abstracts Views on Vision4Press platform.
Data correspond to usage on the plateform after 2015. The current usage metrics is available 48-96 hours after online publication and is updated daily on week days.
Initial download of the metrics may take a while.