Fig. 5
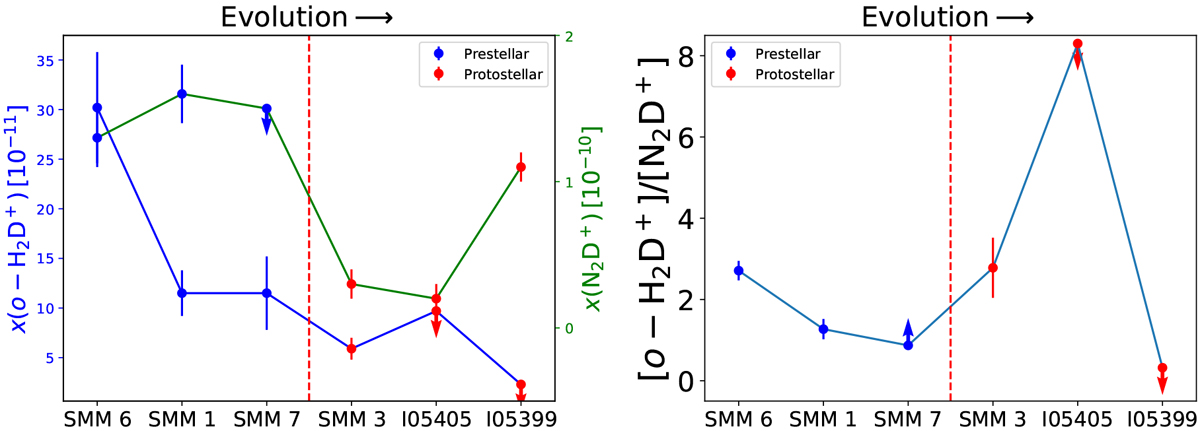
Fractional abundances of o-H2D+ and N2D+ (left panel) and their abundance ratio (right panel) plotted as a function of the potential source evolutionary sequence (see text for details). The arrows pointing up and down indicate the lower and upper limits, respectively. The red, vertical dashed line separates the prestellar phase of evolution on the left from the protostellar phase on the right.
Current usage metrics show cumulative count of Article Views (full-text article views including HTML views, PDF and ePub downloads, according to the available data) and Abstracts Views on Vision4Press platform.
Data correspond to usage on the plateform after 2015. The current usage metrics is available 48-96 hours after online publication and is updated daily on week days.
Initial download of the metrics may take a while.