Free Access
Fig. 4
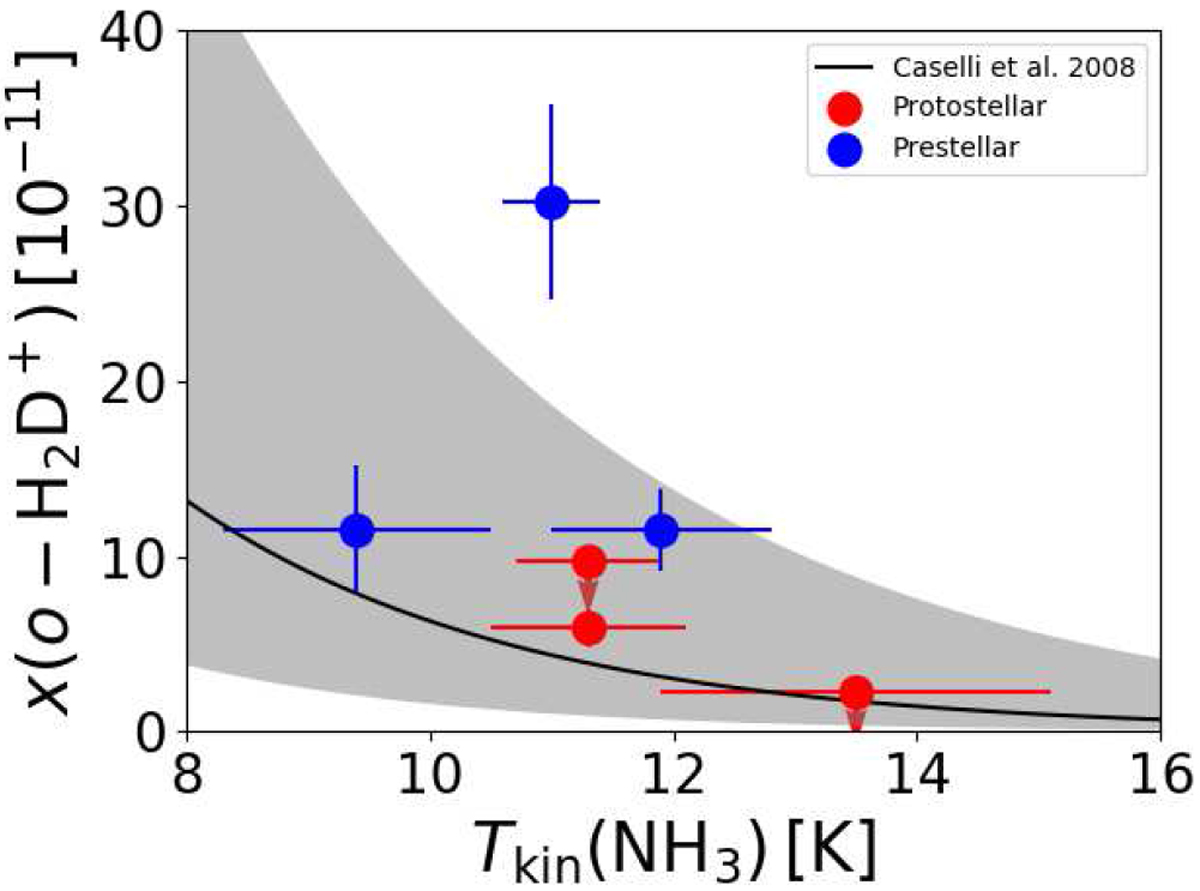
ortho-H2D+ abundance as a function of the NH3-based gas kinetictemperature. The down-pointing arrows indicate upper limits. The black-solid curve represents the x(o − H2D+) − Tkin relationship derived by Caselli et al. (2008), and the grey-shaded region shows its uncertainty.
Current usage metrics show cumulative count of Article Views (full-text article views including HTML views, PDF and ePub downloads, according to the available data) and Abstracts Views on Vision4Press platform.
Data correspond to usage on the plateform after 2015. The current usage metrics is available 48-96 hours after online publication and is updated daily on week days.
Initial download of the metrics may take a while.