Fig. 1
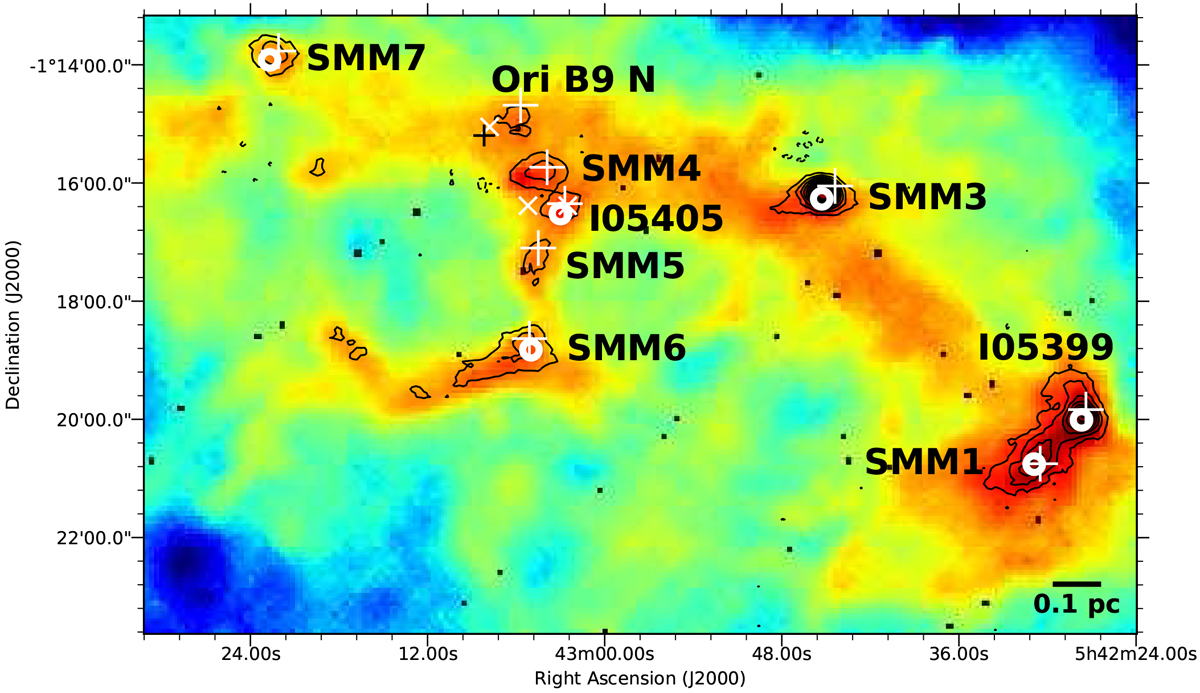
Herschel/SPIRE (Spectral and Photometric Imaging REceiver) 250 μm image towards Orion B9. The image is displayed using a non-linear (arcsinh) stretch, which allows us to better see the faint, extended dust emission. The overlaid contours represent the LABOCA 870 μm emission (Miettinen et al. 2009); the contours start at 3σ, and increase in steps of 3σ, where 3σ = 90 mJy beam−1. The circles indicate the target positions of the present o-H2D+ observations(i.e. SABOCA 350 μm emission peaks of the cores, Miettinen et al. 2012; Miettinen & Offner 2013a), and the circle size corresponds to the beam size of these observations (16.′′8 HPBW). The white plus signs show the target positions of the spectral line observations from Miettinen et al. (2010); Miettinen (2012), while the white crosses show the o-H2D+ target positions observed by Harju et al. (2006). The black plus symbol marks the position from which Caselli et al. (2008) searched for o-H2D+ emission. A scale bar of 0.1 pc projected length is shown in the bottom right corner.
Current usage metrics show cumulative count of Article Views (full-text article views including HTML views, PDF and ePub downloads, according to the available data) and Abstracts Views on Vision4Press platform.
Data correspond to usage on the plateform after 2015. The current usage metrics is available 48-96 hours after online publication and is updated daily on week days.
Initial download of the metrics may take a while.