Fig. 9.
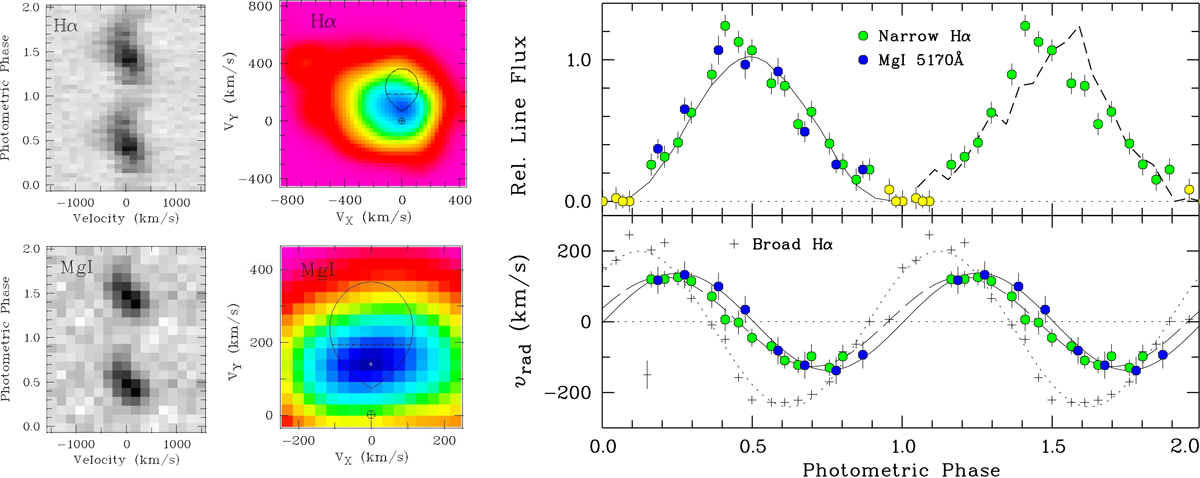
Left: Hα and Mg Iλ5170 emission lines derived from the spectropolarimetry of 31 Dec 2008, with the neighboring continuum subtracted and shown twice for better visibility. Center: corresponding Doppler maps computed by the maximum entropy method MEM. The overlays show the Roche lobes of the secondary for the best bloated model of Sect. 7.5. Top right: the first orbit shows the orbital flux variations of the Mg I line (blue) and the narrow component of Hα (green). The second orbit shows the Hα flux and its mirror image around ϕ = 0.5 (see text). Bottom right: radial velocity curves of the MgI line (blue), the narrow Hα component (green), and the broad Hα component (crosses). A typical error bar for the broad line is shown in the lower left.
Current usage metrics show cumulative count of Article Views (full-text article views including HTML views, PDF and ePub downloads, according to the available data) and Abstracts Views on Vision4Press platform.
Data correspond to usage on the plateform after 2015. The current usage metrics is available 48-96 hours after online publication and is updated daily on week days.
Initial download of the metrics may take a while.