Fig. 8.
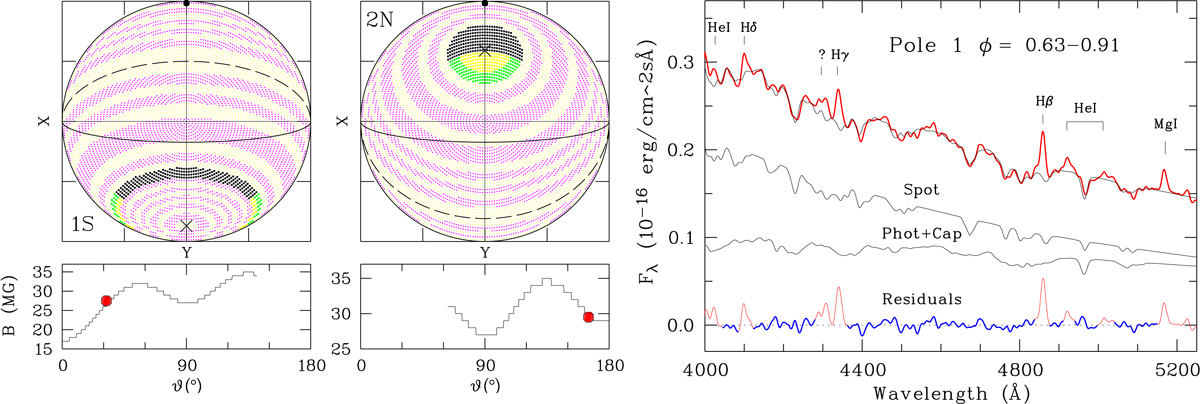
Left panels: magnetic-field distributions of the WD for the case B multipole model of Table 8 and the phases of best visibility of spots 1S and 2N. The footpoints of the rotational and the magnetic axes are indicated by the black dot and the cross (×), respectively. The magnetic equator and the orbital plane are marked by the dashed and the solid black line, respectively. The individual projected-area elements are marked by tiny dots, selecting or suppressing every second integer field strength. The spot field is marked in green and the viewing-angle selected spot is emphasized in black. The bottom panels show the model field strength vs. the magnetic colatitude ϑ. The red dots mark the spot fields. Right panel: observed pole-1 spectrum (red curve) with the best-fit Zeeman spectrum for the adopted multipole model (black curves). The residuals of the fit are displayed at the bottom with the wavelength sections that are included in the fit highlighted in blue.
Current usage metrics show cumulative count of Article Views (full-text article views including HTML views, PDF and ePub downloads, according to the available data) and Abstracts Views on Vision4Press platform.
Data correspond to usage on the plateform after 2015. The current usage metrics is available 48-96 hours after online publication and is updated daily on week days.
Initial download of the metrics may take a while.