Fig. 7.
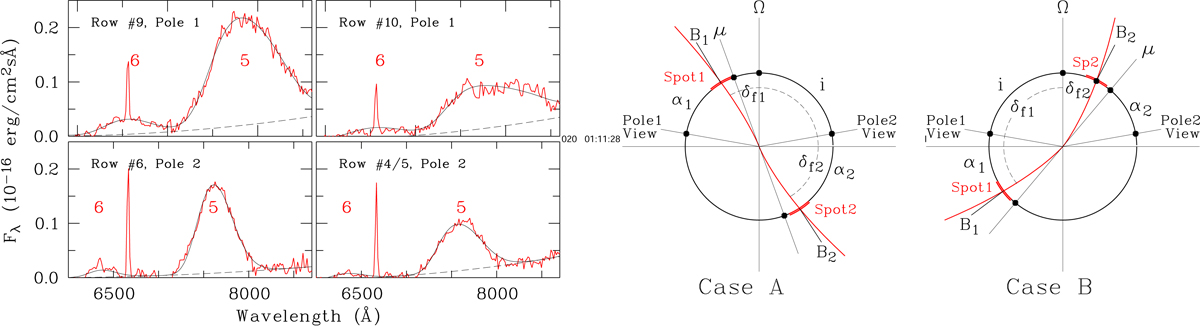
Left: cyclotron spectra of poles 1 and 2 (red curves) least-squares fitted with constant-temperature models for the plasma parameters listed in Table 6 (black curves). Right panels: magnetic geometry of the WD for case A and case B accretion (see text). The secondary star is located to the left. Angles are measured between the dots on the circumference. Dipolar field lines are included as red curves.
Current usage metrics show cumulative count of Article Views (full-text article views including HTML views, PDF and ePub downloads, according to the available data) and Abstracts Views on Vision4Press platform.
Data correspond to usage on the plateform after 2015. The current usage metrics is available 48-96 hours after online publication and is updated daily on week days.
Initial download of the metrics may take a while.