Fig. 6.
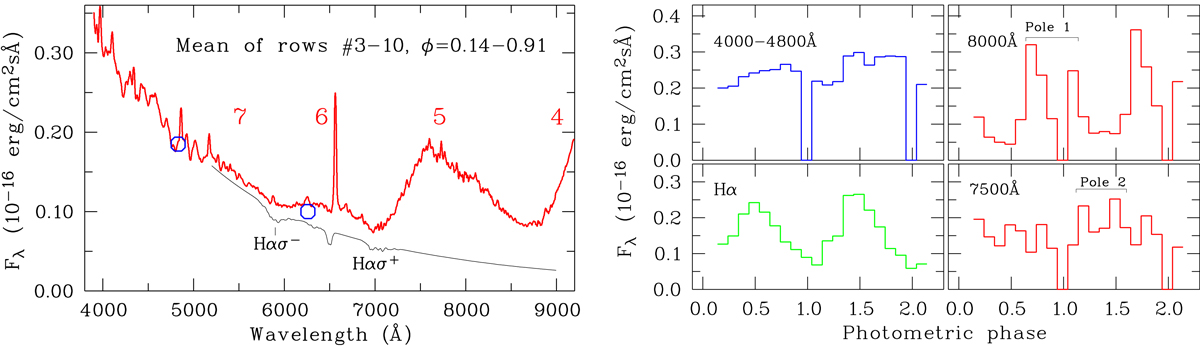
Left: mean bright-phase dereddened intensity spectrum of the 2008 spectropolarimetry with the contribution of the secondary star subtracted (red curve). For comparison, the appropriate model spectrum of a magnetic WD is shown (black curve). The mean fluxes of the November 2017 and February 2018 gr photometry are included as the two open blue circles. The red numbers indicate the cyclotron harmonics. Right: light curves for selected wavelength intervals derived from spectral set 1 before phasefolding, but after subtraction of the secondary star. The individual panels show the quasi-B band flux, the cyclotron beaming of the pole-1 and pole-2 emissions, and the Hα line flux (in arbitrary units).
Current usage metrics show cumulative count of Article Views (full-text article views including HTML views, PDF and ePub downloads, according to the available data) and Abstracts Views on Vision4Press platform.
Data correspond to usage on the plateform after 2015. The current usage metrics is available 48-96 hours after online publication and is updated daily on week days.
Initial download of the metrics may take a while.