Fig. 5.
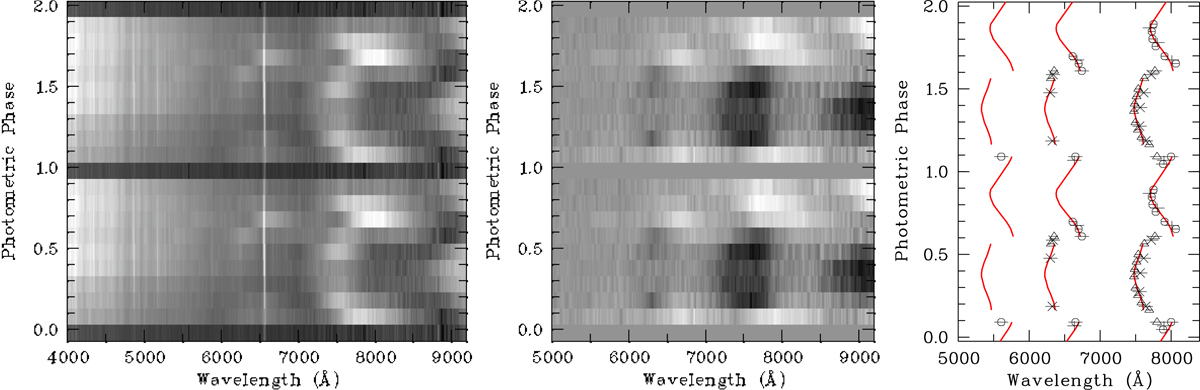
Left: intensity spectra of the 2008 spectropolarimetry with the contribution of the secondary star subtracted. The mean spectra of two orbits are shown twice for visual continuity. Two systems of cyclotron lines are visible that originate near two poles of similar field strength. Center: circular polarization spectra with white indicating positive and black negative polarization. Right: maxima of the cyclotron lines of both poles (circles, triangles), extrema of the circular polarization (plus signs, crosses), and best-fit line positions as functions of orbital phase (red curves).
Current usage metrics show cumulative count of Article Views (full-text article views including HTML views, PDF and ePub downloads, according to the available data) and Abstracts Views on Vision4Press platform.
Data correspond to usage on the plateform after 2015. The current usage metrics is available 48-96 hours after online publication and is updated daily on week days.
Initial download of the metrics may take a while.