Fig. 4.
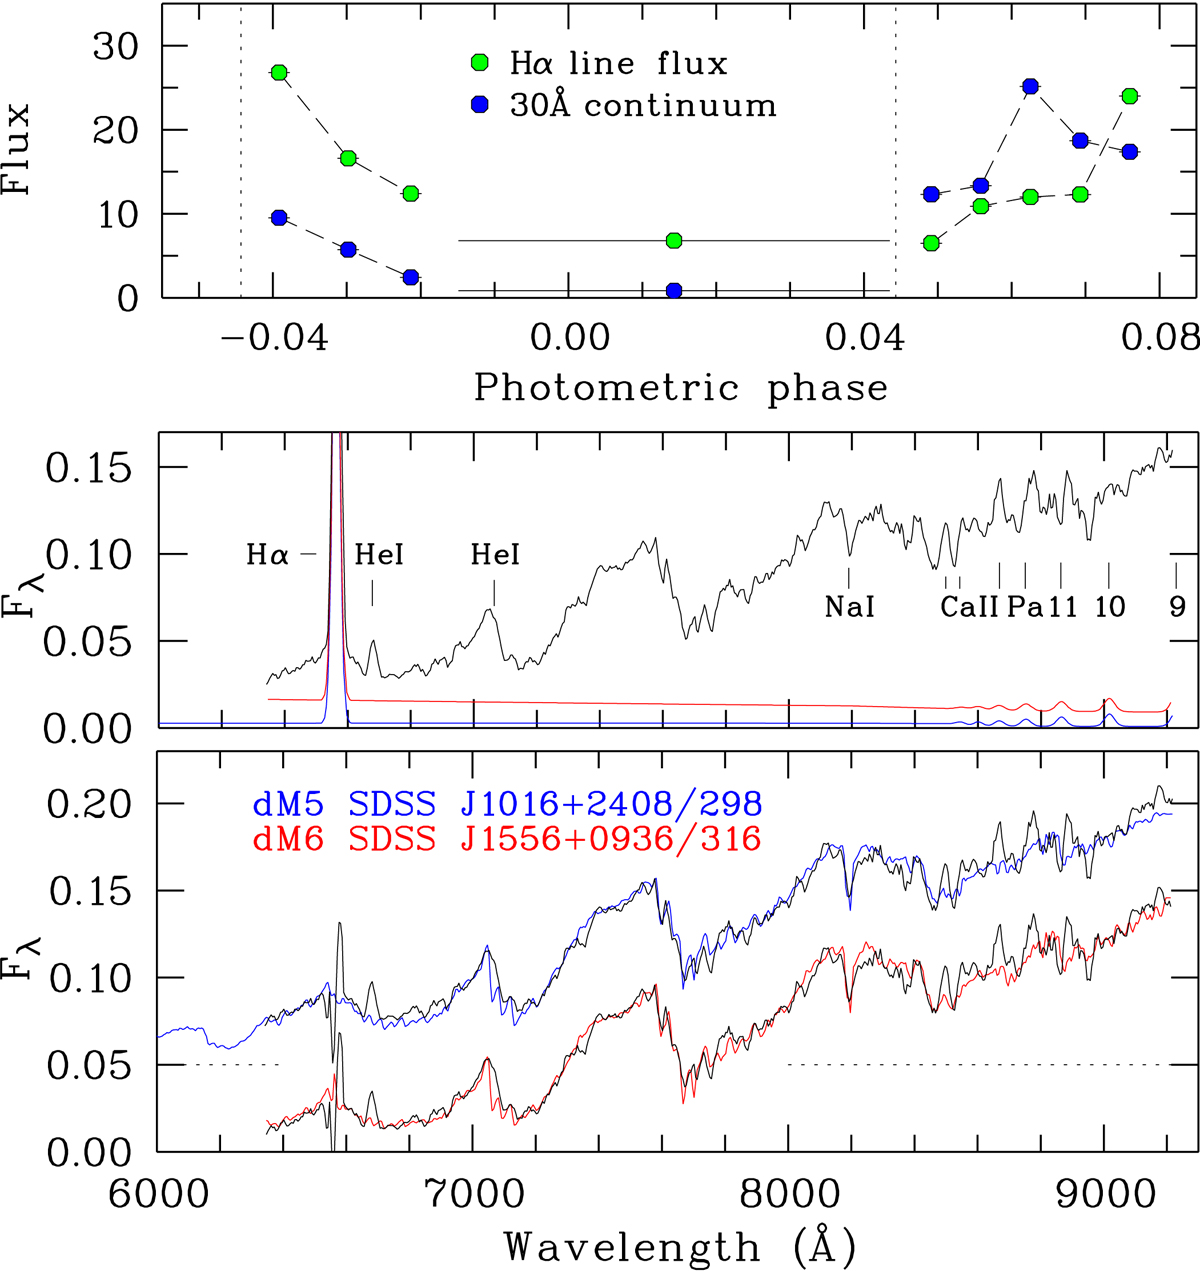
Top: eclipse light curve of the Hα emission line flux in erg cm−2 s−1 and of the underlying continuum flux observed on 20 November 2000. Center: eclipse spectrum (black curve) thermal hydrogen spectrum adjusted to fit the Hα line flux (blue or red curve, see text). The ordinate is in units of 10−16 erg cm−2 s−1 Å−1. Bottom: difference spectra on the same color coding fitted by a dM6 star (red) and a dM5 star (blue, shifted upward by 0.05 units).
Current usage metrics show cumulative count of Article Views (full-text article views including HTML views, PDF and ePub downloads, according to the available data) and Abstracts Views on Vision4Press platform.
Data correspond to usage on the plateform after 2015. The current usage metrics is available 48-96 hours after online publication and is updated daily on week days.
Initial download of the metrics may take a while.