Fig. 3.
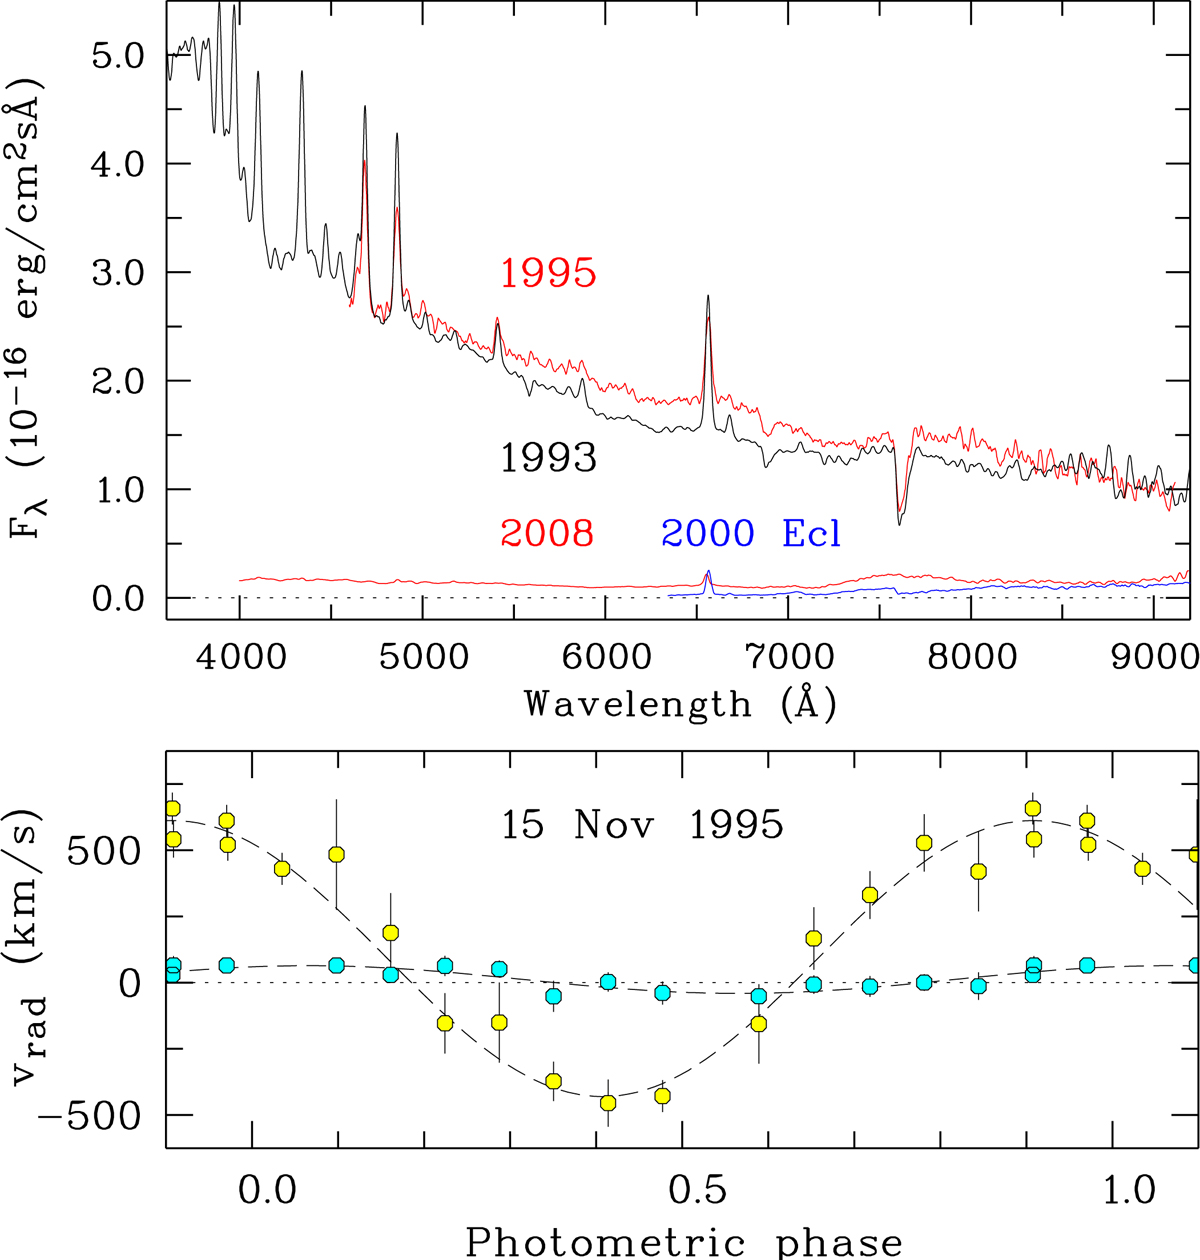
Top: mean flux-calibrated low-resolution spectra of HY Eri in the high states of 1993 and 1995. For comparison, the eclipse spectrum of 2000 (blue curve) and the mean out-of-eclipse spectrum in the 2008 low state (red curve) are added on the same ordinate scale. Bottom: mean radial velocities of the broad emission lines of Hβ and HeIIλ4686 (open circles) and of the line peaks (cyan dots) derived from medium-resolution spectra taken on 15 November 1995.
Current usage metrics show cumulative count of Article Views (full-text article views including HTML views, PDF and ePub downloads, according to the available data) and Abstracts Views on Vision4Press platform.
Data correspond to usage on the plateform after 2015. The current usage metrics is available 48-96 hours after online publication and is updated daily on week days.
Initial download of the metrics may take a while.