Fig. 2.
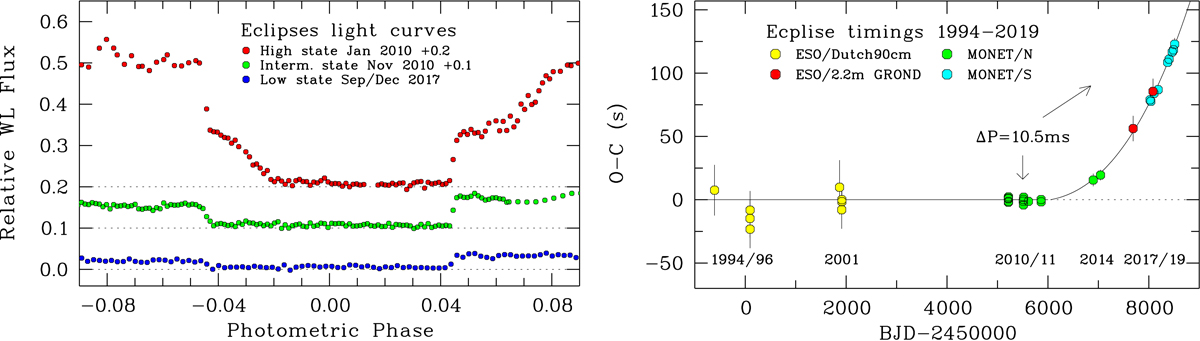
Left: eclipse light curves in the high, intermediate, and in the low state, the former two shifted upward to avoid overlap. Phases are from Eq. (1) for the high and intermediate states and from and Eq. (2) for the low state. Right: O − C diagram for the deviations of the mid-eclipse times from the linear ephemeris of Eq. (1), showing the change in orbital period.
Current usage metrics show cumulative count of Article Views (full-text article views including HTML views, PDF and ePub downloads, according to the available data) and Abstracts Views on Vision4Press platform.
Data correspond to usage on the plateform after 2015. The current usage metrics is available 48-96 hours after online publication and is updated daily on week days.
Initial download of the metrics may take a while.