Fig. 11.
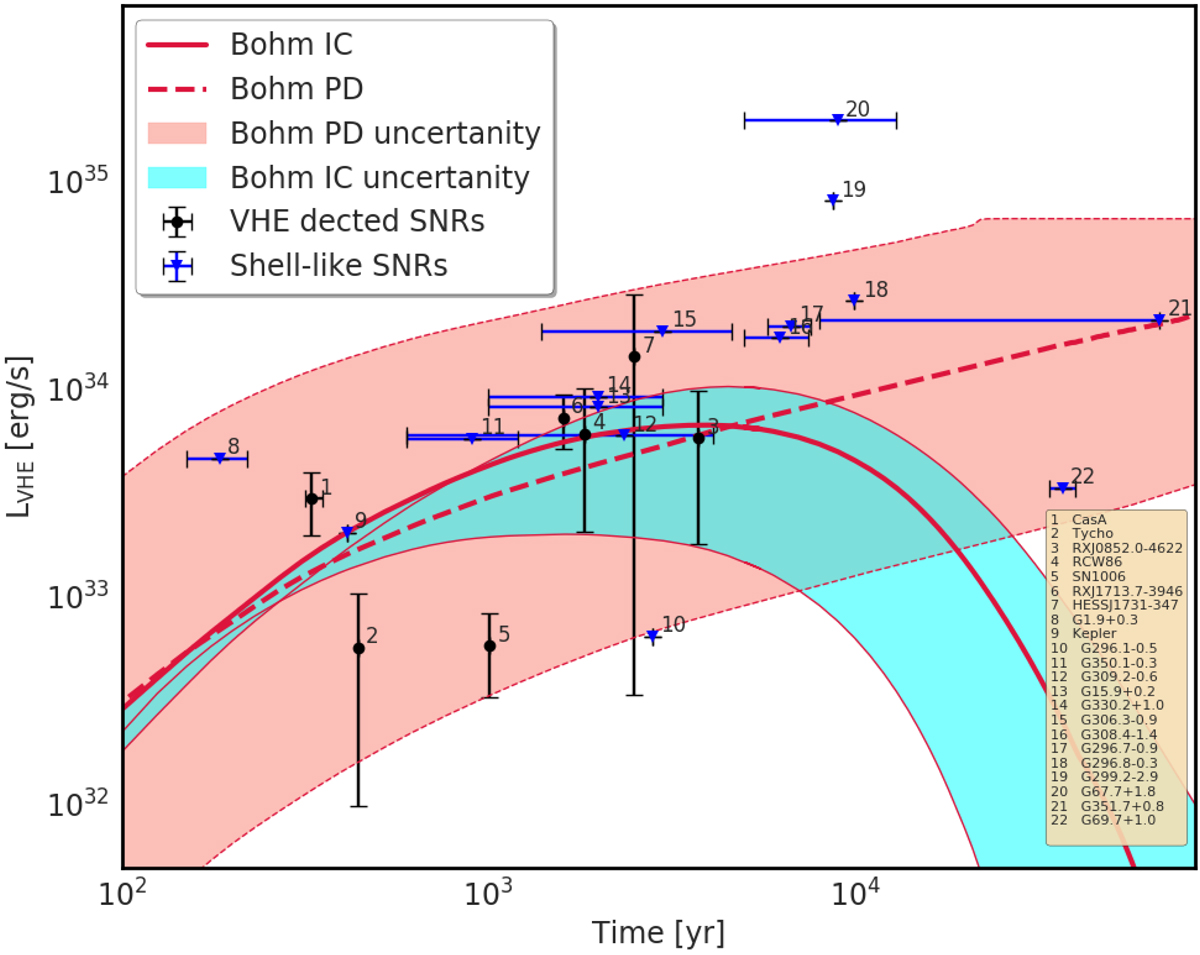
Observed gamma-ray luminosity of galactic SNRs in the TeV band; blue markers indicate upper limits. The red curves reflect the models with Bohm-like diffusion and indicate inverse-Compton (solid lines) and pion-decay (dashed lines) emission. The thick curves are calculated for a ambient gas density of 0.4 cm−3. The shaded uncertainty bands represent the range of luminosity expected for a density in the range 0.04 − 4.0 cm−3. The references for the data points are given in the text.
Current usage metrics show cumulative count of Article Views (full-text article views including HTML views, PDF and ePub downloads, according to the available data) and Abstracts Views on Vision4Press platform.
Data correspond to usage on the plateform after 2015. The current usage metrics is available 48-96 hours after online publication and is updated daily on week days.
Initial download of the metrics may take a while.