Fig. 7.
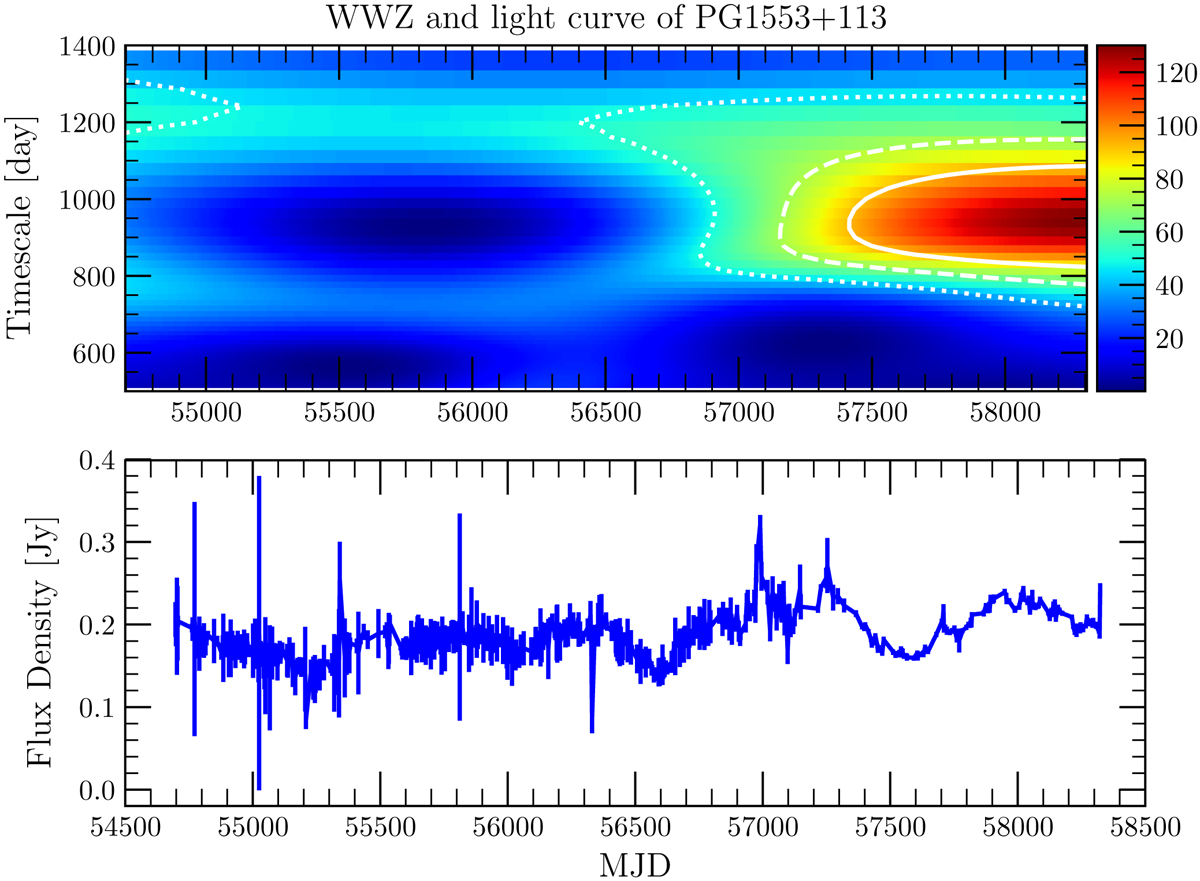
Upper frame: two-dimensional WWZ power (colour scale on the right side) distribution as a function of time (x-axis) and period (y-axis) of the 15 GHz OVRO light curve over the MJD range 54696-58153. The significance intervals are plotted as white contours, in which the dotted, dashed, and solid lines represent 1σ, 2σ, and 3σ, respectively. Lower frame: OVRO light curve over the MJD range 54696-58153.
Current usage metrics show cumulative count of Article Views (full-text article views including HTML views, PDF and ePub downloads, according to the available data) and Abstracts Views on Vision4Press platform.
Data correspond to usage on the plateform after 2015. The current usage metrics is available 48-96 hours after online publication and is updated daily on week days.
Initial download of the metrics may take a while.