Fig. 5.
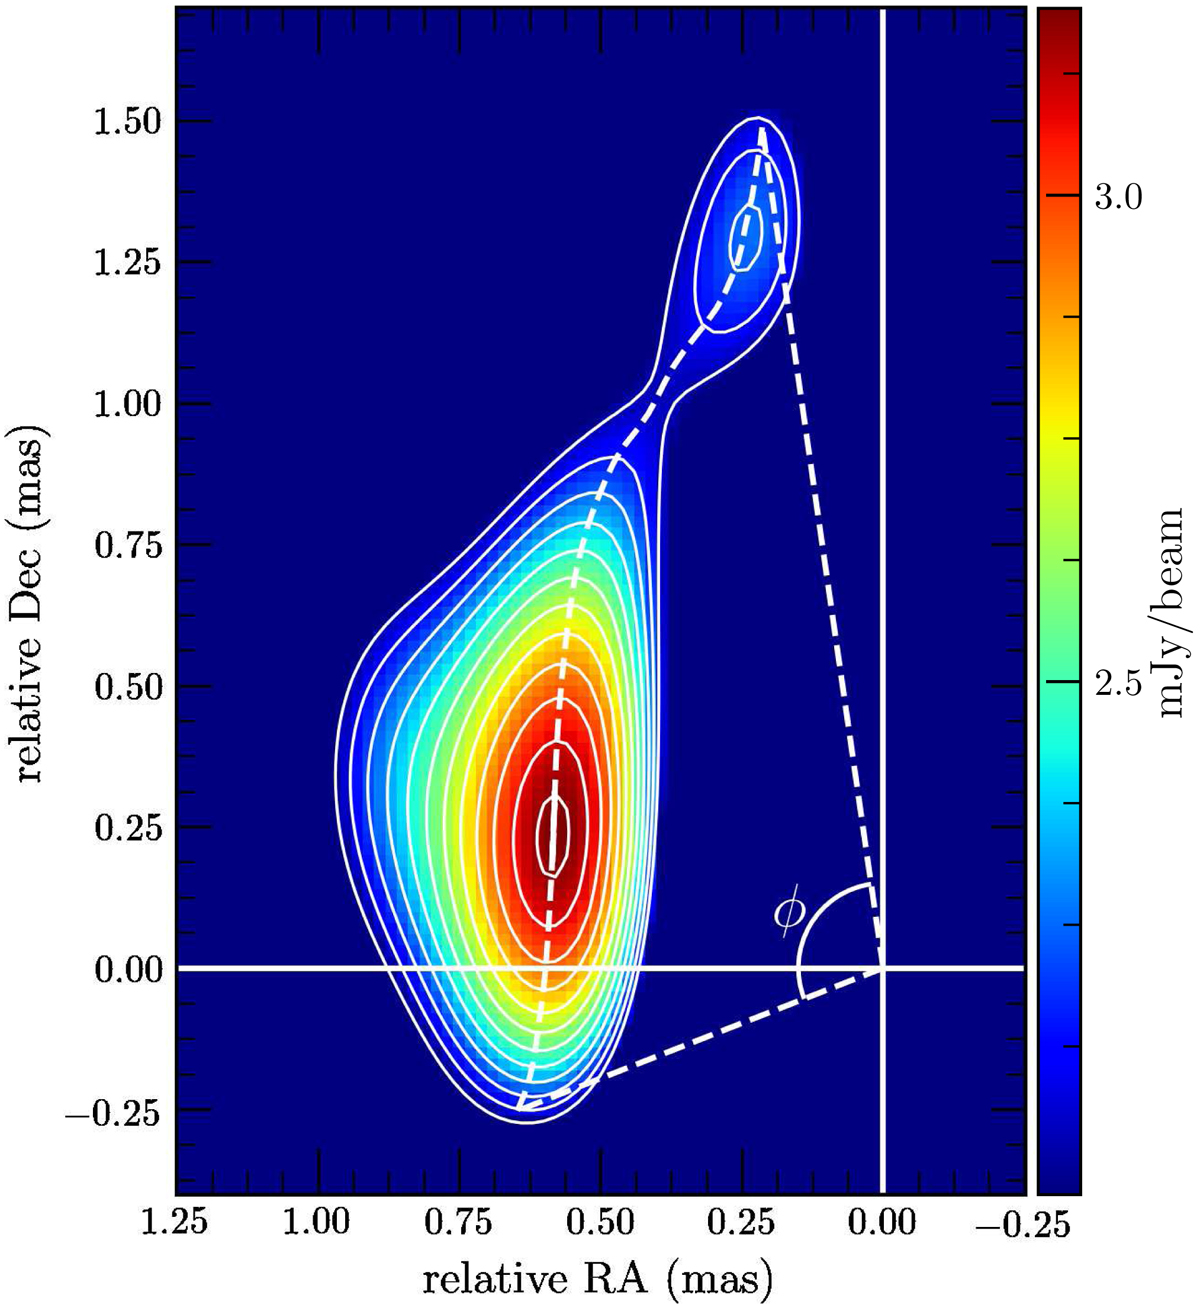
15 GHz residual stacked image after core subtraction (see Sect. 3.3). The colour scale represents the total intensity emission. The lowest contour is three times the image noise (that is ∼0.34 mJy beam−1), with the following contours being a factor of two higher. The ϕ symbol represents the angle of the funnel in which the jet wobbles across time.
Current usage metrics show cumulative count of Article Views (full-text article views including HTML views, PDF and ePub downloads, according to the available data) and Abstracts Views on Vision4Press platform.
Data correspond to usage on the plateform after 2015. The current usage metrics is available 48-96 hours after online publication and is updated daily on week days.
Initial download of the metrics may take a while.