Fig. 3.
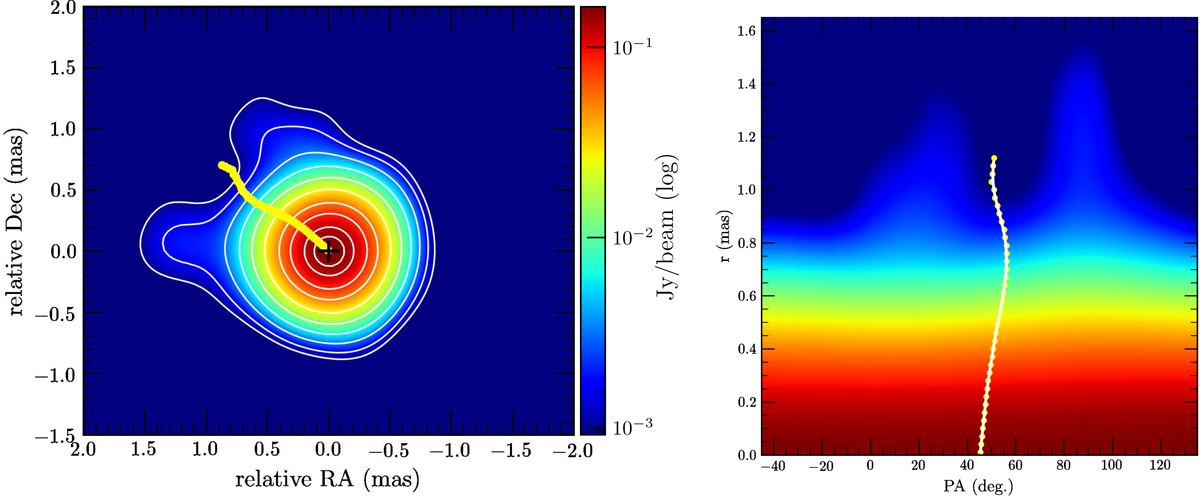
Left image: 15 GHz total intensity (contours and colour scale) image of PG 1553+113 during the third observing epoch (MJD 57276), convolved with a 0:6 mas 0:6 mas circular beam. The overlaid lowest total intensity contour is at 0.6% of the peak, with the following contours a factor of two higher. The ridge line is overlaid as a yellow line. Right image: same 15 GHz image in polar coordinates. The colour scale represents the total intensity emission and the white line represents the ridge line.
Current usage metrics show cumulative count of Article Views (full-text article views including HTML views, PDF and ePub downloads, according to the available data) and Abstracts Views on Vision4Press platform.
Data correspond to usage on the plateform after 2015. The current usage metrics is available 48-96 hours after online publication and is updated daily on week days.
Initial download of the metrics may take a while.