Fig. 2.
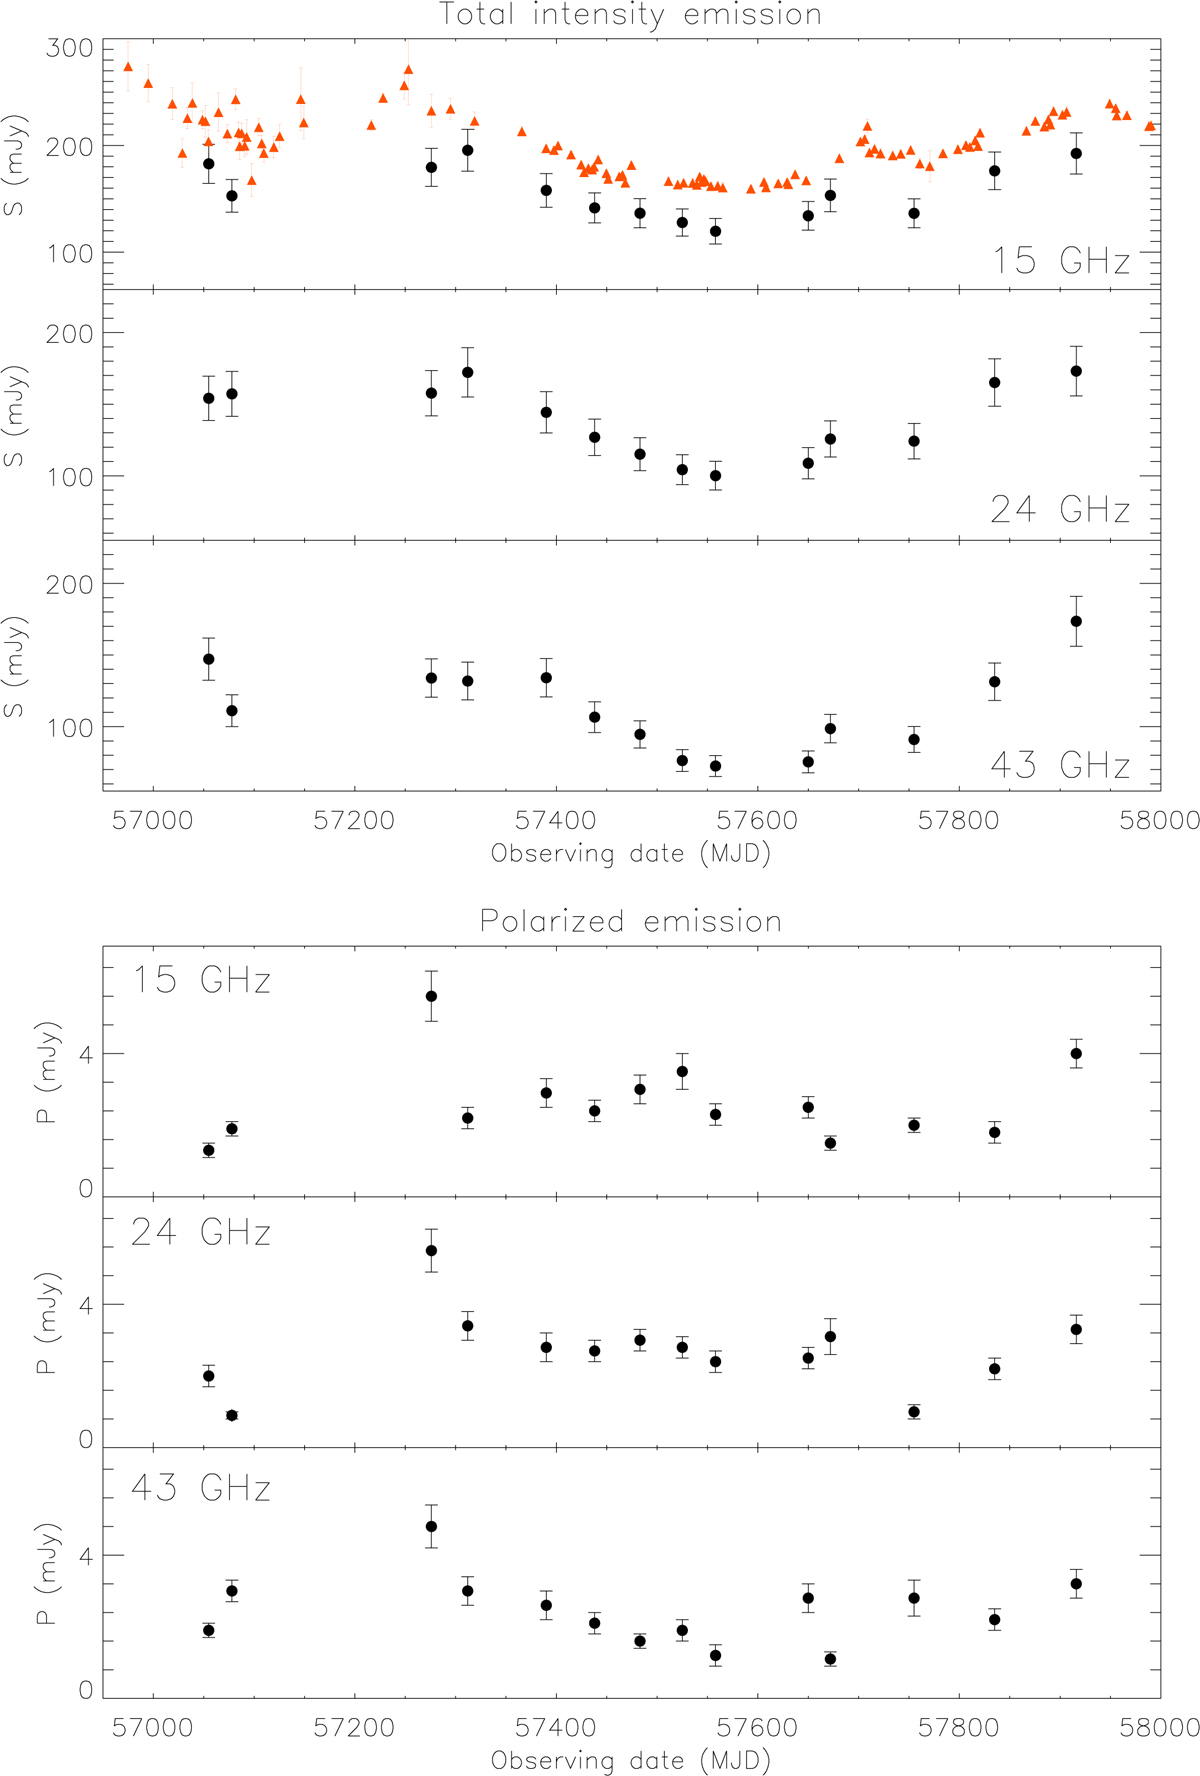
Evolution with time of the total intensity (upper image) and polarised flux density (lower image) in the core region of PG 1553+113 during the MJD 57055–57916 period. In each image we report the 15 GHz (upper frame), 24 GHz (middle frame), and 43 GHz (lower frame) results. The overlaid red triangles in the upper image (top panel) represent the 15 GHz OVRO light curve in the MJD range 56974–57990.
Current usage metrics show cumulative count of Article Views (full-text article views including HTML views, PDF and ePub downloads, according to the available data) and Abstracts Views on Vision4Press platform.
Data correspond to usage on the plateform after 2015. The current usage metrics is available 48-96 hours after online publication and is updated daily on week days.
Initial download of the metrics may take a while.