Fig. 1.
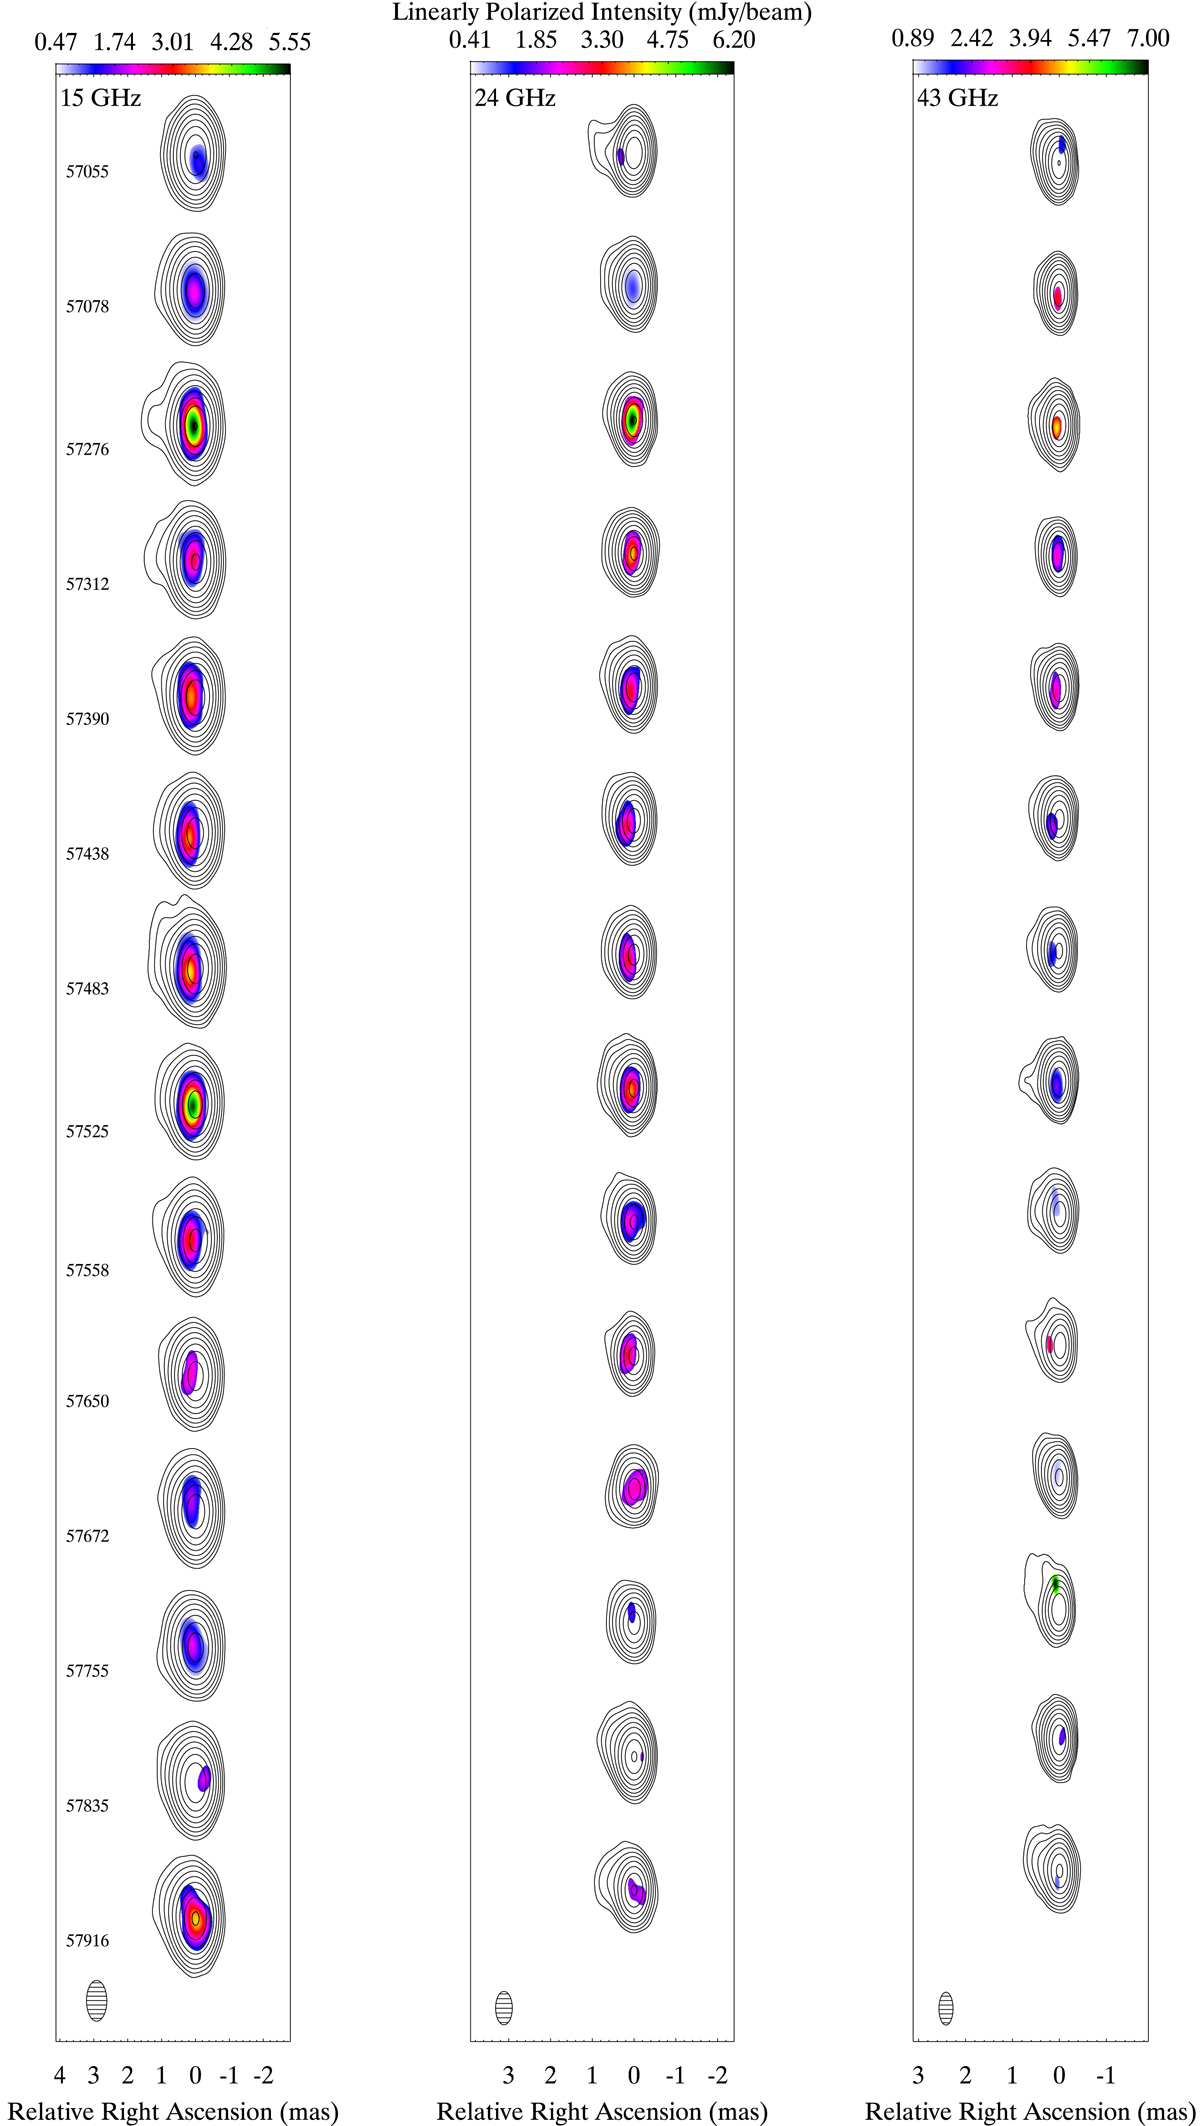
Natural weighted 15 GHz (left panel), 24 GHz (middle panel), and 43 GHz (right panel) VLBA images of PG 1553+113 from the first observing epoch (top image in each panel) to the fourteenth epoch (bottom image in each panel). The vertical separation between images is not proportional to the time difference between epochs. The images at each frequency have been convolved with a common beam with FWHM 0.6 mas × 1.2 mas, 0.4 mas × 0.8 mas and 0.3 mas × 0.7 mas at 15, 24 and 43 GHz, respectively, as shown in the bottom-left corner in each panel. The overlaid lowest total intensity contour is at 0.4%, 1.3%, and 1.8% of the peak at 15, 24, and 43 GHz (see Table 2), respectively, with the following contours a factor of two higher. The colour scale represents the linearly polarised intensity.
Current usage metrics show cumulative count of Article Views (full-text article views including HTML views, PDF and ePub downloads, according to the available data) and Abstracts Views on Vision4Press platform.
Data correspond to usage on the plateform after 2015. The current usage metrics is available 48-96 hours after online publication and is updated daily on week days.
Initial download of the metrics may take a while.