Fig. 6.
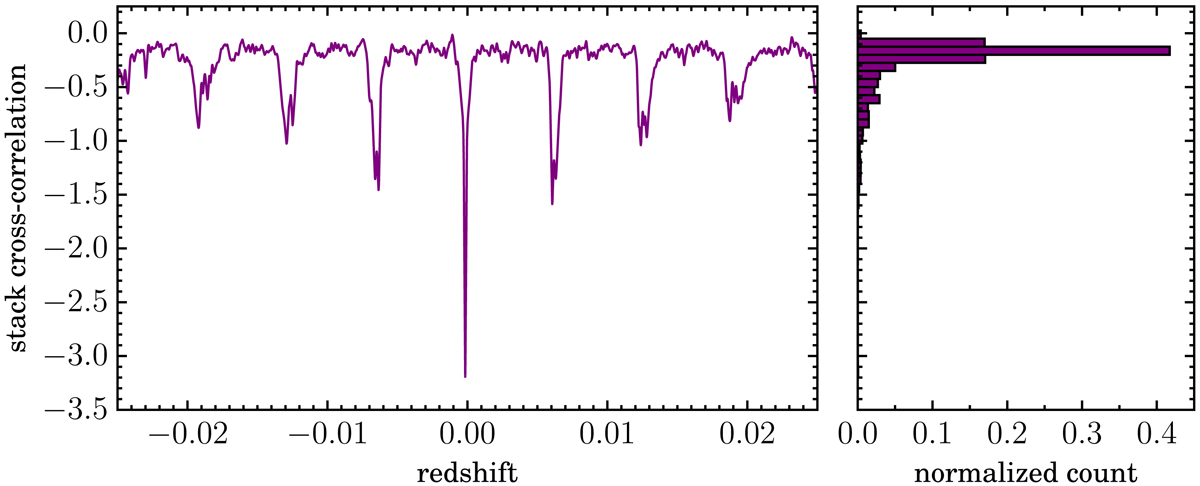
Integrated optical depth of the observed Cas A spectra cross-correlated with the expected template spectrum. The outlying peak at the redshift (z = −0.000158) of the −47 km s−1 component is clearly visible. The histogram on the right shows the binned distribution of integrated optical depth. Cas A α-transition stacking demonstrates our method in a regime with a high signal-to-noise ratio.
Current usage metrics show cumulative count of Article Views (full-text article views including HTML views, PDF and ePub downloads, according to the available data) and Abstracts Views on Vision4Press platform.
Data correspond to usage on the plateform after 2015. The current usage metrics is available 48-96 hours after online publication and is updated daily on week days.
Initial download of the metrics may take a while.