Fig. B.3.
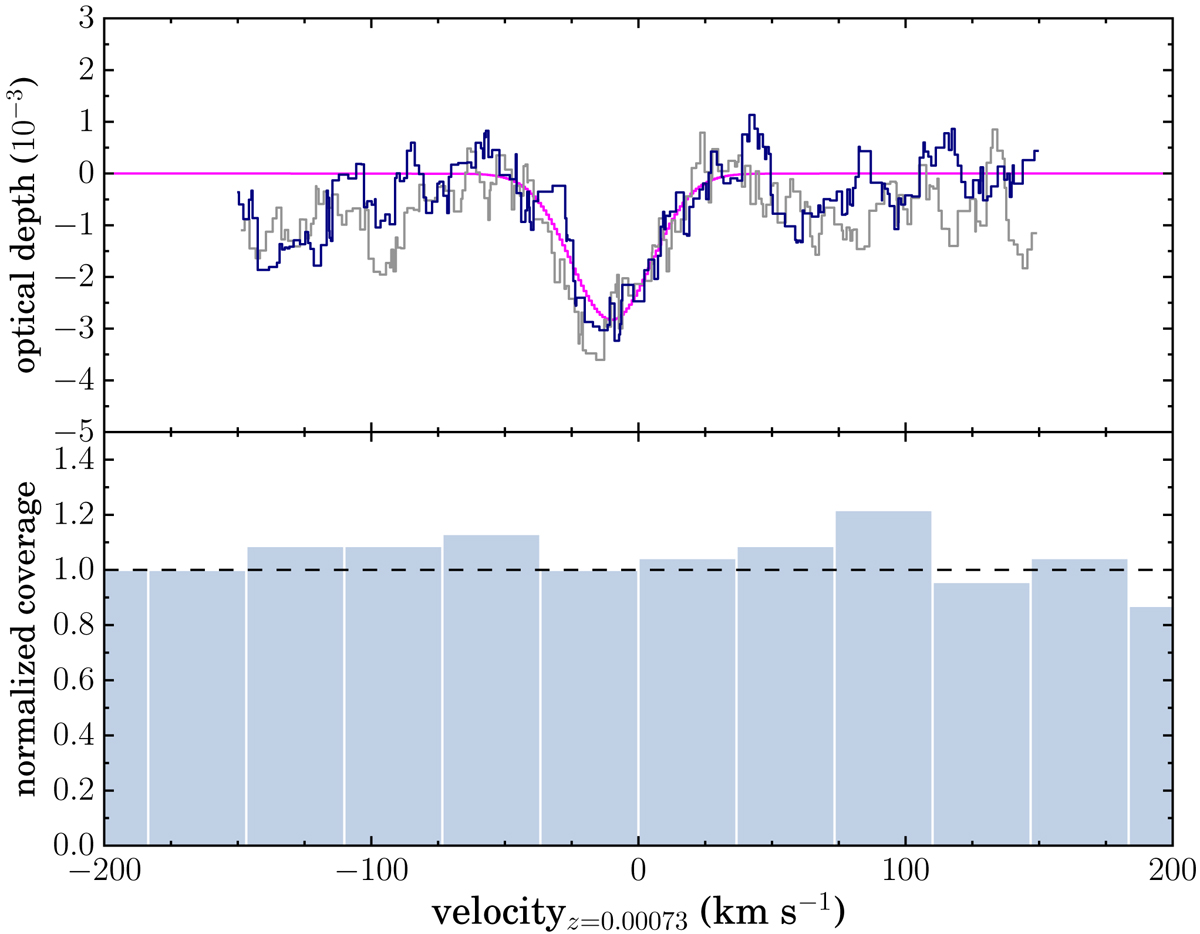
Optical depth as a function of velocity for the RRL spectrum of M 82 stacked at zM 82 = 0.00073 and smoothed with a Savitzky-Golay filter (top). In blue we show the spectrum we reproduced following the criteria of M14; the magenta line shows the best-fit Gaussian. The standard deviation in the line-free channels is 6.5 × 10⁻⁴. In gray we show the final M14 spectrum (courtesy L. Morabito). The bottom plot shows the coverage, or number of subband data points, within velocity bins of 36.7 km s−1. The coverage count has been normalized by 23, which is the number of data points in the bin where the line peak falls.
Current usage metrics show cumulative count of Article Views (full-text article views including HTML views, PDF and ePub downloads, according to the available data) and Abstracts Views on Vision4Press platform.
Data correspond to usage on the plateform after 2015. The current usage metrics is available 48-96 hours after online publication and is updated daily on week days.
Initial download of the metrics may take a while.