Fig. 14.
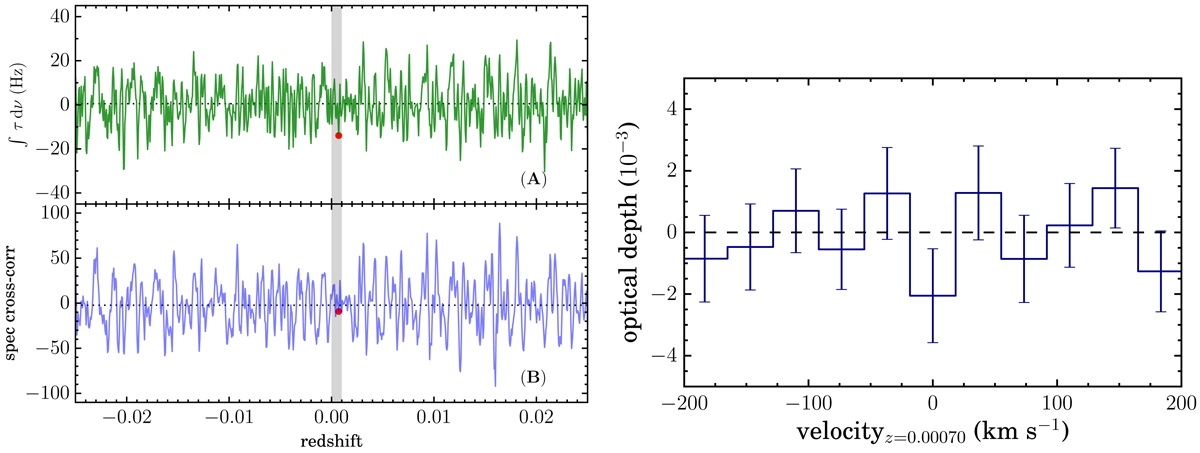
Our results for M 82. Left: same as in Fig. 8, but applied to the Cα-transitions of M 82. We did not proceed with the stack cross-correlation because no significant outlier was identified in (B). The shaded region in gray shows the redshift range probed by M14. The red data point shows zM 82 = 0.00070, the redshift corresponding to the peak of the RRL emission, as reported by M14. Right: stacked spectrum of M 82, in velocity units, with respect to zM 82 = 0.00070. The error bars reflect the standard deviation of a weighted mean (see Sect. 3.1).
Current usage metrics show cumulative count of Article Views (full-text article views including HTML views, PDF and ePub downloads, according to the available data) and Abstracts Views on Vision4Press platform.
Data correspond to usage on the plateform after 2015. The current usage metrics is available 48-96 hours after online publication and is updated daily on week days.
Initial download of the metrics may take a while.