Fig. 11.
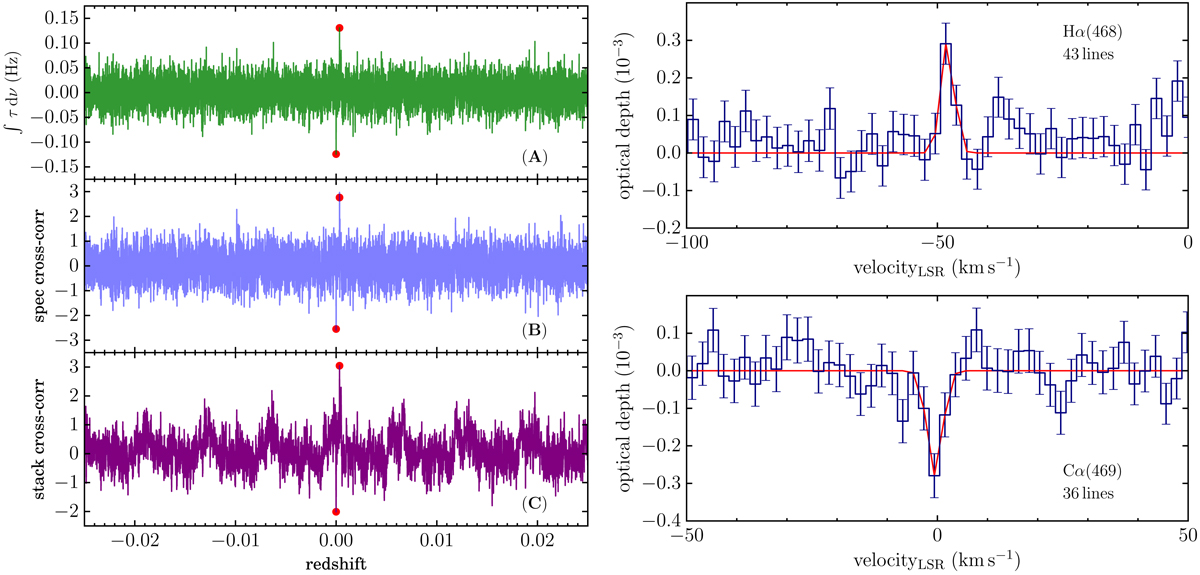
Left: same as in Fig. 8, but applied to Cα transitions in Cas A spectra. Fits to the −47 km s−1 and −38 km s−1 components (and all higher order transitions) have been subtracted in the spectrum of Cas A. Residuals remaining from imperfect subtraction of the brightest α transitions from −47 km s−1 and −38 km s−1 components can be seen in (C). These results demonstrate the behavior of the method in the presence of narrow spectral lines with a low signal-to-noise ratio. The redshifts (zH = 0.000337 and zC = −0.000002, with respect to stacking for Cα) of the two detections are shown in red. Right: stacked spectrum of Hα (top) associated with the −47 km s−1 component, one of the lowest frequency detections of hydrogen RRLs. Cα (bottom) associated with the Orion Arm, detected at this frequency for the first time.
Current usage metrics show cumulative count of Article Views (full-text article views including HTML views, PDF and ePub downloads, according to the available data) and Abstracts Views on Vision4Press platform.
Data correspond to usage on the plateform after 2015. The current usage metrics is available 48-96 hours after online publication and is updated daily on week days.
Initial download of the metrics may take a while.