Fig. 10.
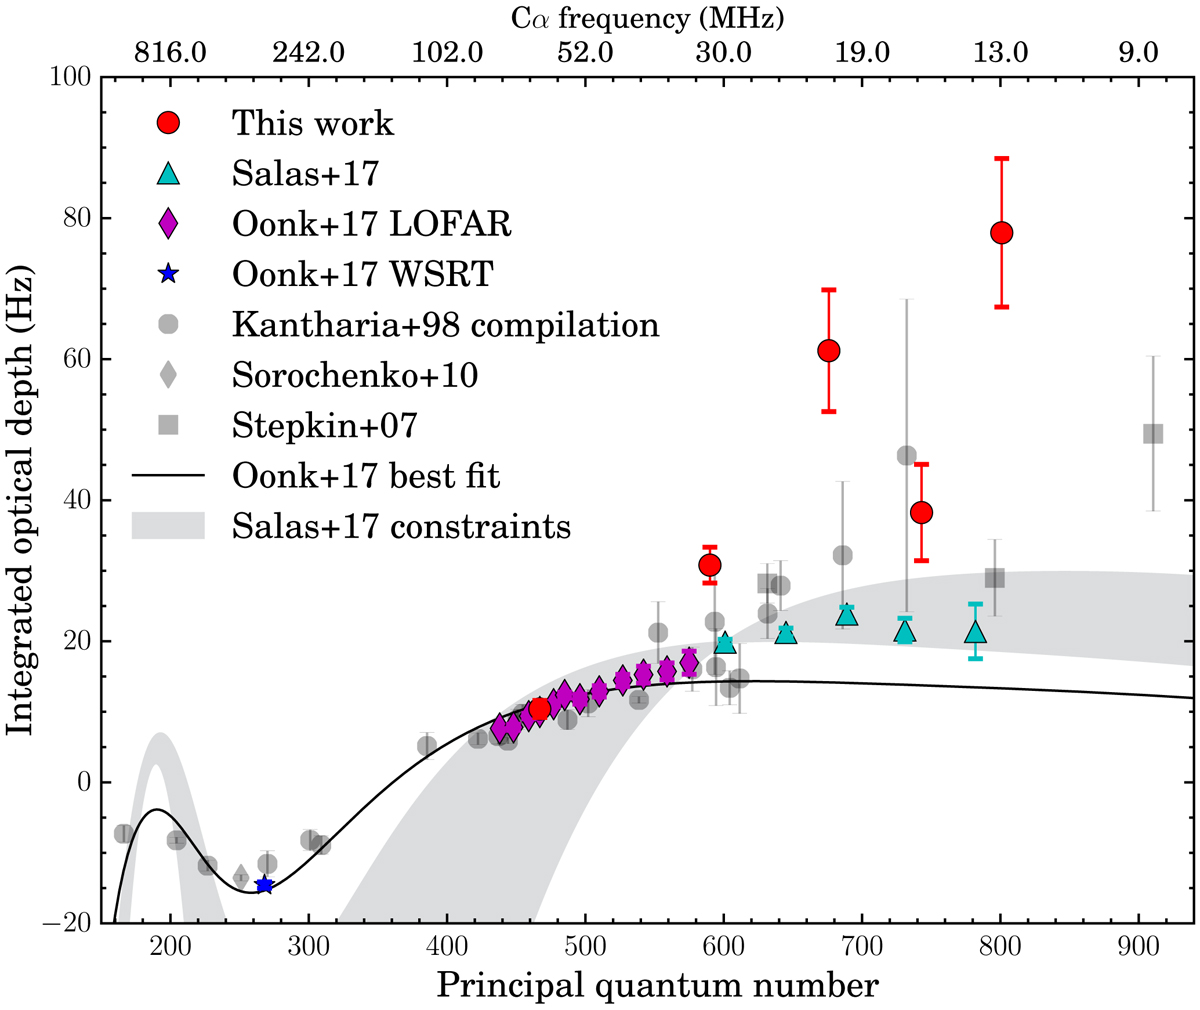
Integrated optical depth as a function of principal quantum number for the sum of the Perseus Arm components at −47 and −38 km s−1 adapted from S17. The cyan triangles show the 10–33 MHz LOFAR observations of S17. The purple diamonds represent the 33–78 MHz LOFAR detections, and the blue star shows the WSRT detection (O17). Pre-LOFAR literature data are shown as gray data points (Kantharia et al. 1998; Stepkin et al. 2007; Sorochenko & Smirnov 2010). The black solid line is the best-fitting model from O17. The gray shaded region covers the models that correspond to the physical constraints from S17.
Current usage metrics show cumulative count of Article Views (full-text article views including HTML views, PDF and ePub downloads, according to the available data) and Abstracts Views on Vision4Press platform.
Data correspond to usage on the plateform after 2015. The current usage metrics is available 48-96 hours after online publication and is updated daily on week days.
Initial download of the metrics may take a while.