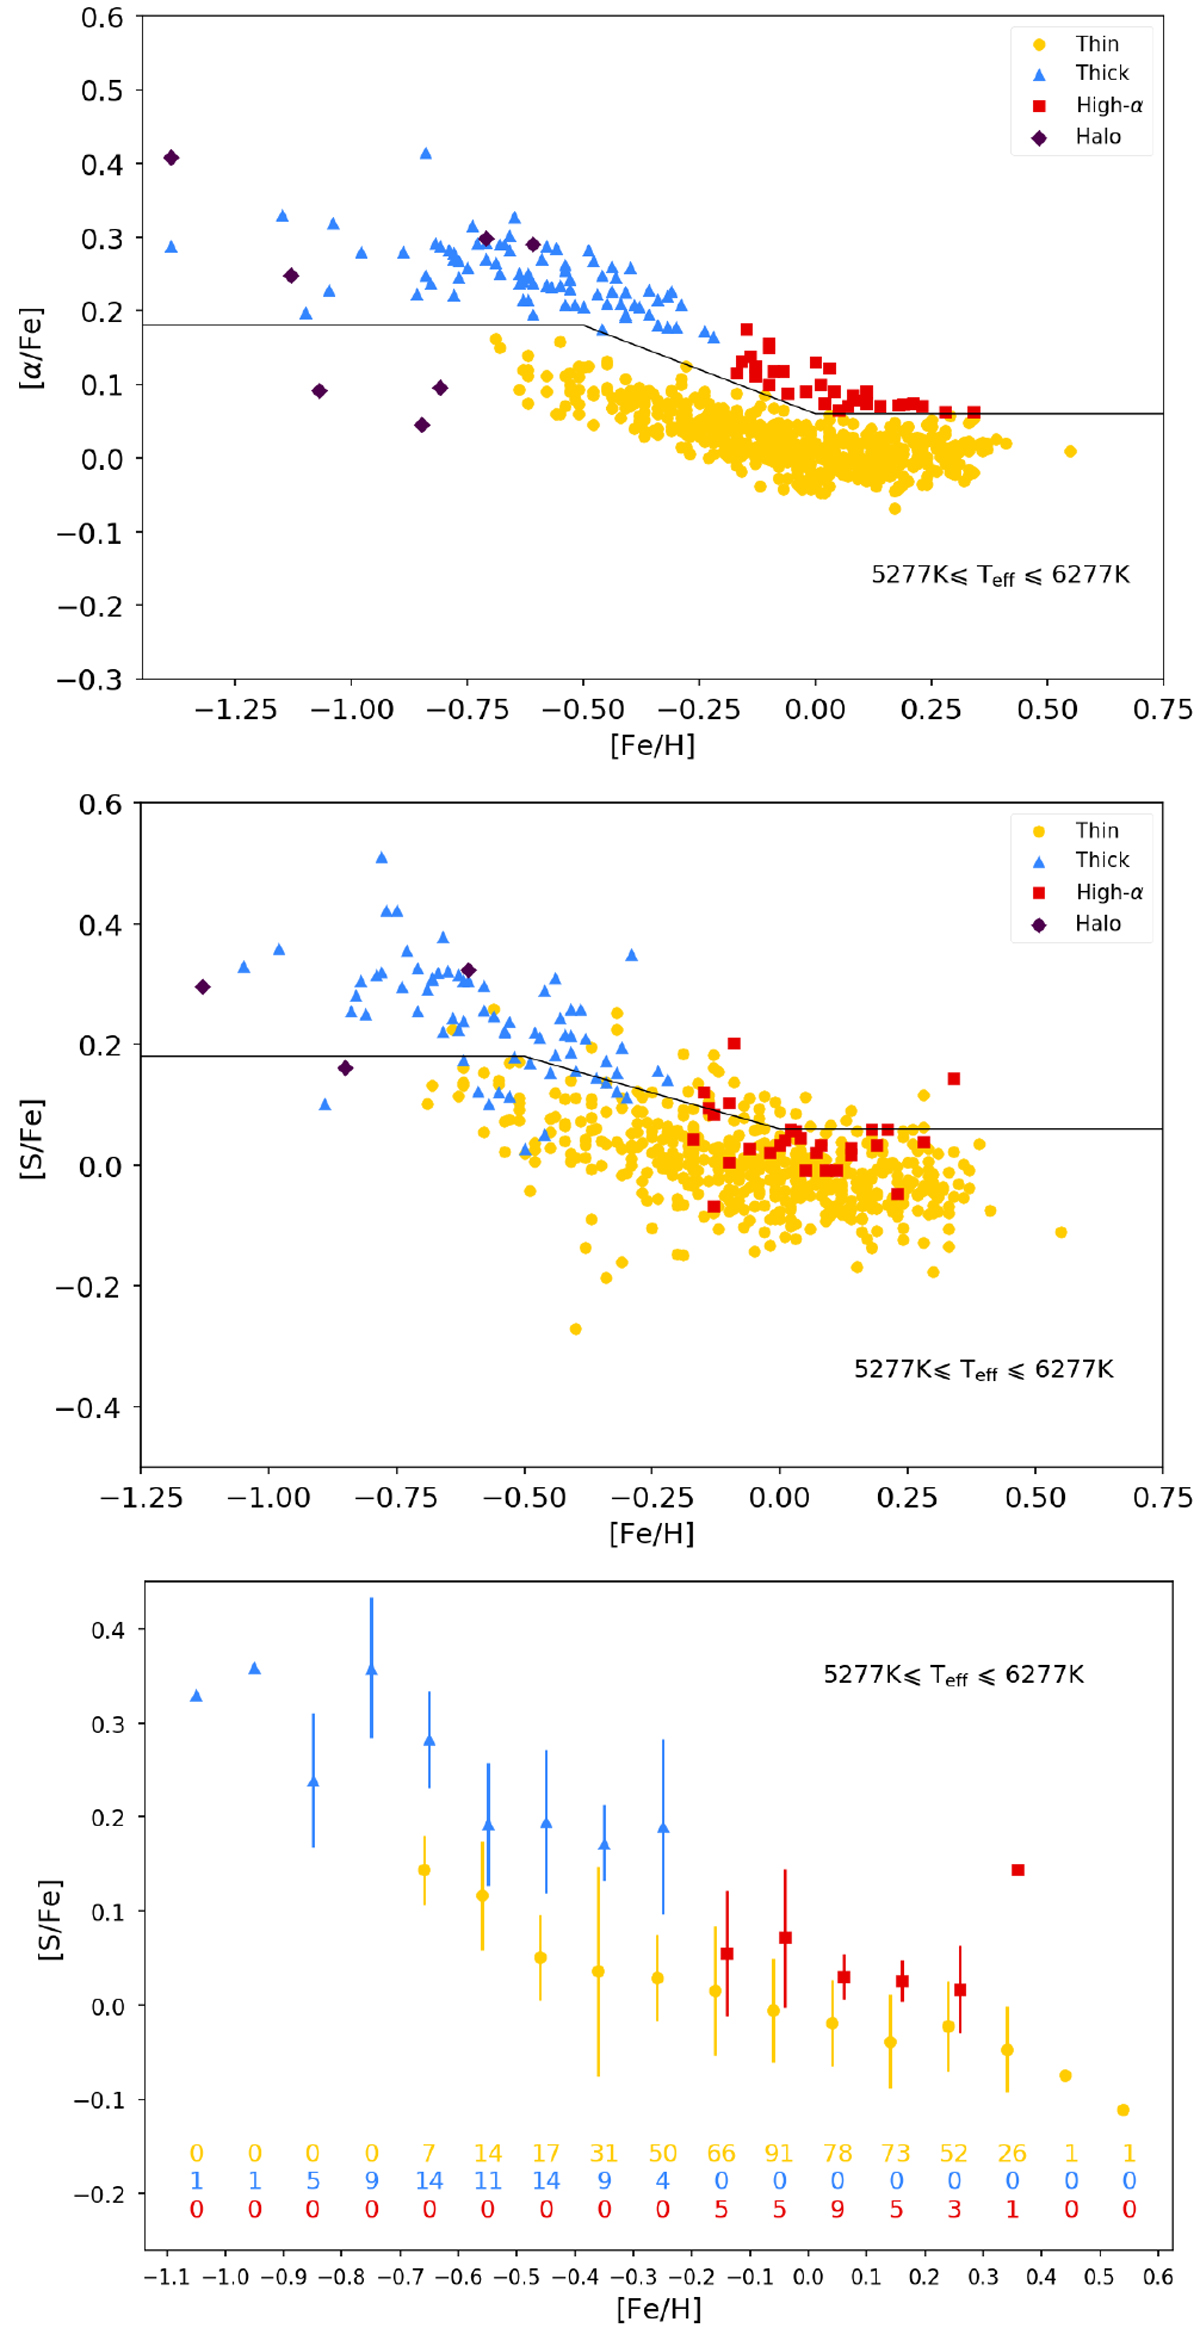
Fig. 5
Top: [α/Fe] vs. [Fe/H ], data from DM17. The black line is the updated α separation line, also from DM17. (see text for more detail). Middle: [S/Fe] vs. [Fe/H], with the same α-line as the top panel. Bottom: Average [S/Fe] for each metallicity bin (of width 0.1 dex) per population. The numbers indicate the size of the sample of each population in each bin. Symbols: yellow circles are for the thin disc, blue triangles for the thick disc, red squares for the high-α metal-rich stars, and purple diamonds for halo stars.
Current usage metrics show cumulative count of Article Views (full-text article views including HTML views, PDF and ePub downloads, according to the available data) and Abstracts Views on Vision4Press platform.
Data correspond to usage on the plateform after 2015. The current usage metrics is available 48-96 hours after online publication and is updated daily on week days.
Initial download of the metrics may take a while.