Fig. 4.
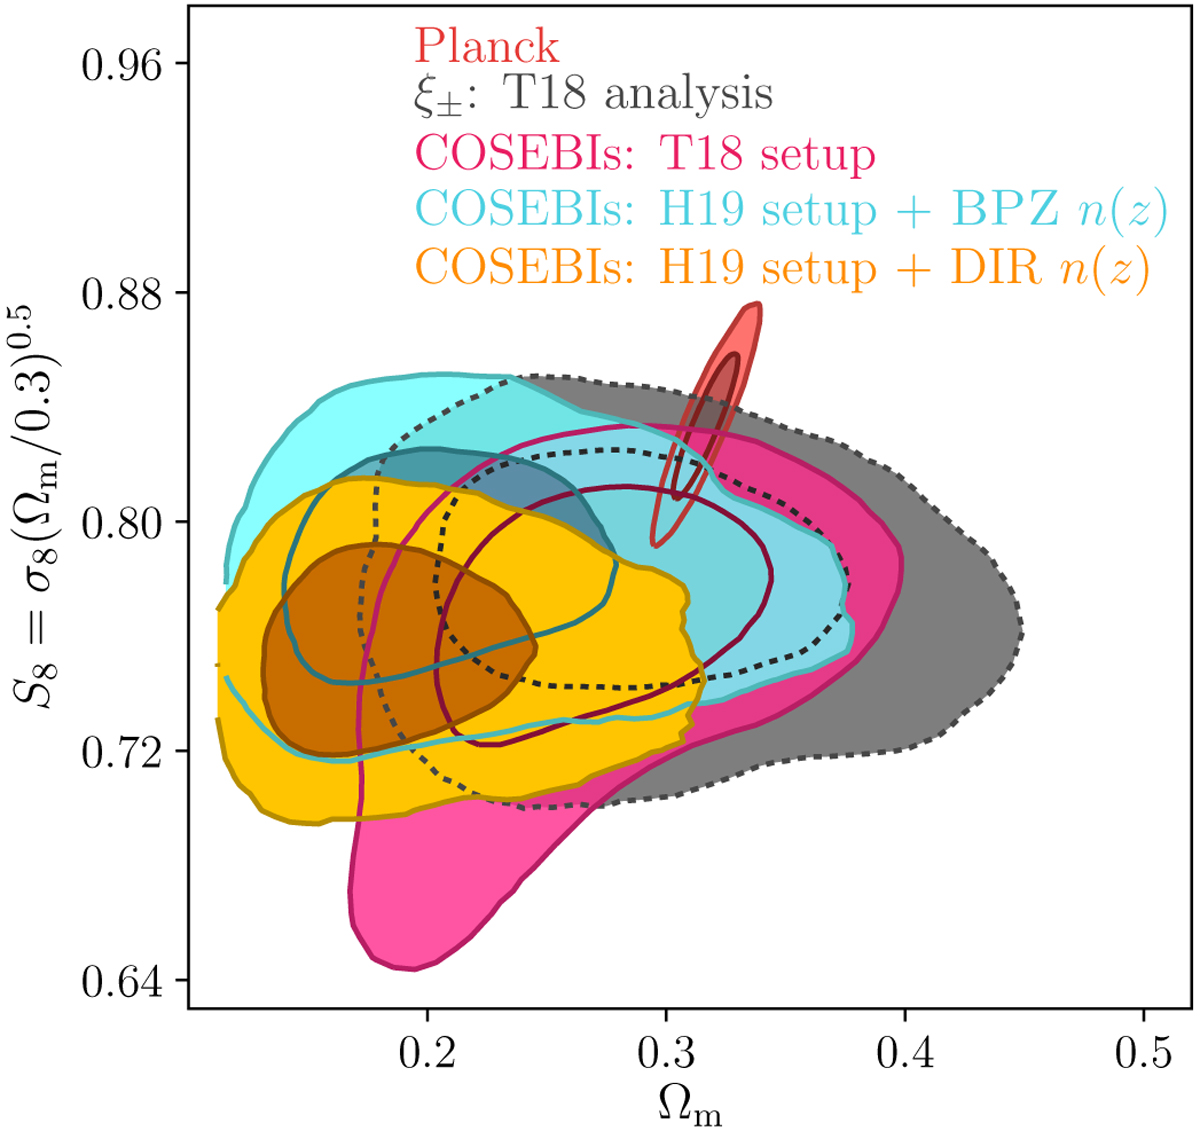
Constraints on S8 and Ωm. DES-Y1 analysis results with COSEBIs using the T18 setup (magenta), the H20 setup with BPZ redshift distributions (cyan) and the H20 setup with DIR calibrated redshift distributions (orange). The grey contours belong to the fiducial analysis in Troxel et al. (2018a) and the red contours show Planck Legacy results (TT,TE,EE+lowE).
Current usage metrics show cumulative count of Article Views (full-text article views including HTML views, PDF and ePub downloads, according to the available data) and Abstracts Views on Vision4Press platform.
Data correspond to usage on the plateform after 2015. The current usage metrics is available 48-96 hours after online publication and is updated daily on week days.
Initial download of the metrics may take a while.