Fig. 3.
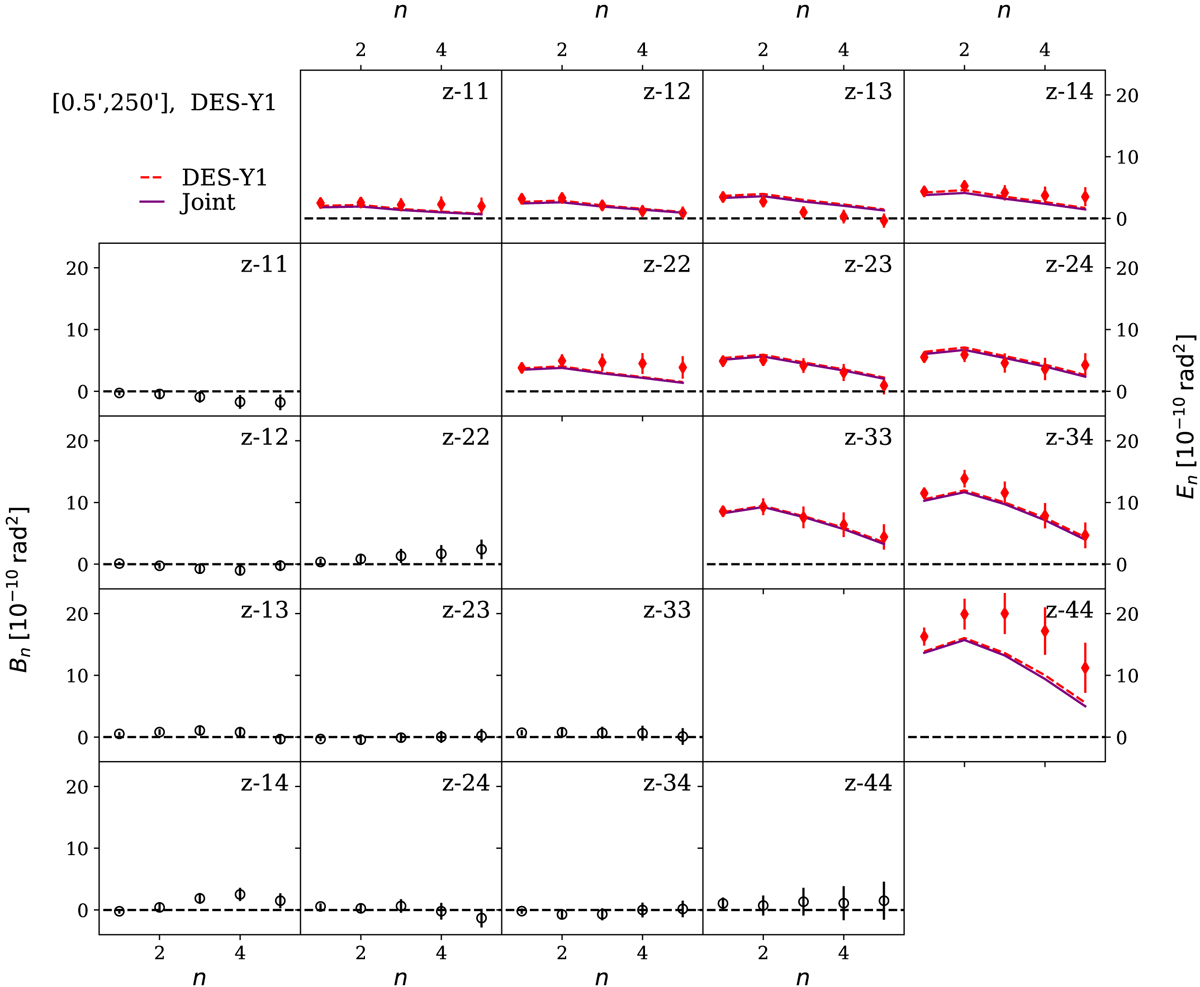
COSEBIs measurements and their expected values for DES-Y1. Similar to Fig. 2, E- and B-modes are shown on the upper and lower triangles, respectively. The redshift bin is indicated in the corner of each panel. Theoretically expected values for the best fitting parameters using DES-Y1 (red dashed) and the joint analysis with KV450 (solid purple) are shown as curves, although COSEBI modes are discrete. Both theoretical models fit the data well (see Table 2). As the data points are correlated the goodness-of-fit cannot be inspected visually.
Current usage metrics show cumulative count of Article Views (full-text article views including HTML views, PDF and ePub downloads, according to the available data) and Abstracts Views on Vision4Press platform.
Data correspond to usage on the plateform after 2015. The current usage metrics is available 48-96 hours after online publication and is updated daily on week days.
Initial download of the metrics may take a while.