Fig. 2.
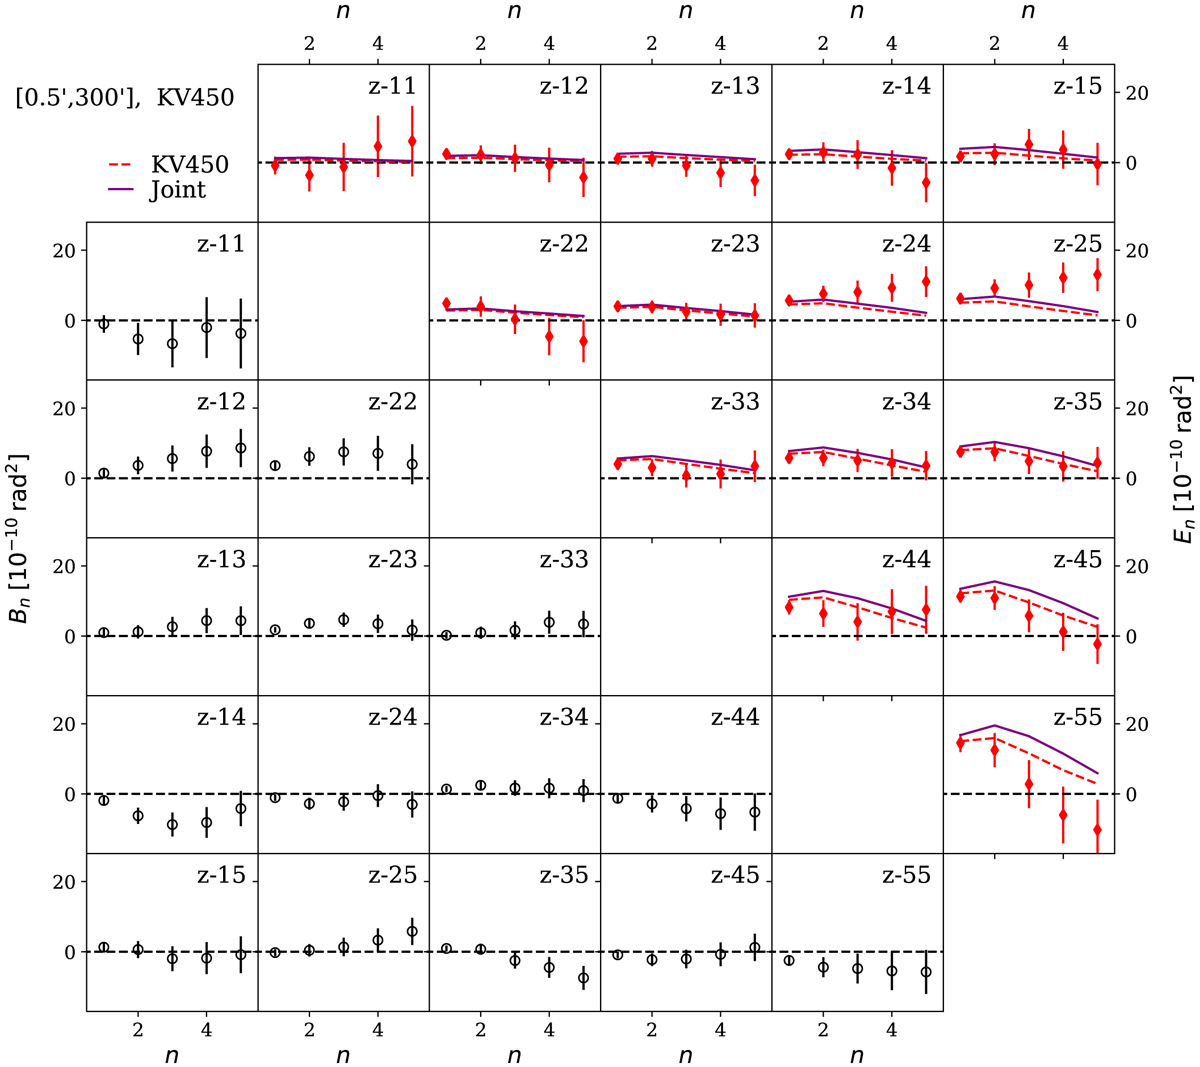
COSEBIs measurements and their expected values for KV450. The E-modes are shown in the upper triangle and the B-modes in the lower triangle. Each panel corresponds to a redshift bin pair as indicated in its corner. Theoretically expected values are shown for the best fitting parameters for KV450 (red dashed) and its combination with DES-Y1 (solid purple). The COSEBI modes are discrete and the points are connected to each other purely for visual purposes. The error on the B-modes is calculated assuming that the only contribution is shape noise, while for the E-modes we take all Gaussian terms as well as the super sample covariance into account (see Appendix A). Neighbouring COSEBI modes are correlated and the goodness-of-fit of the model cannot be established by eye (see Table 2).
Current usage metrics show cumulative count of Article Views (full-text article views including HTML views, PDF and ePub downloads, according to the available data) and Abstracts Views on Vision4Press platform.
Data correspond to usage on the plateform after 2015. The current usage metrics is available 48-96 hours after online publication and is updated daily on week days.
Initial download of the metrics may take a while.