Fig. 8
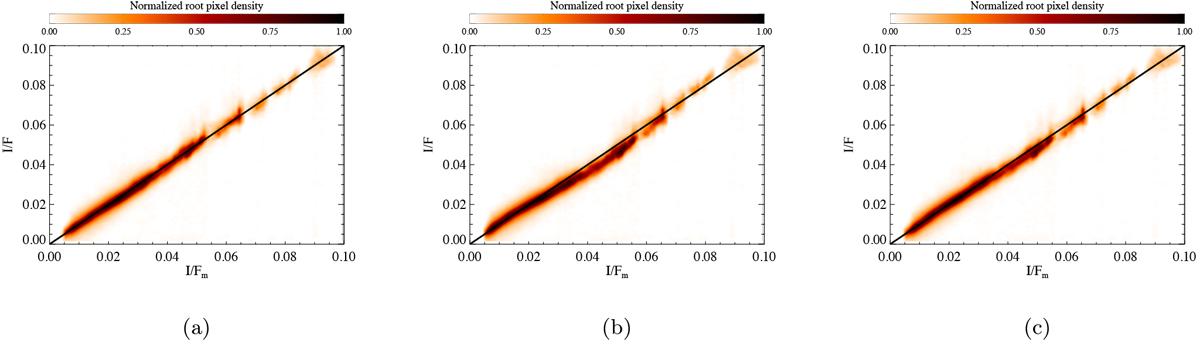
Radiance factor (I∕F) as measured by VIR at 0.55 μm against the modeled values (I∕Fm) at the corresponding observation geometry, for different solutions of the Hapke model discussed in Sect. 3.3: S2 (a), S3 (b), and S4 (c). The black line in each plot indicates the ideal behavior I∕F = I∕Fm. The color in the contour plots is proportional to the square root of the point density after normalization of the maximum value to unity.
Current usage metrics show cumulative count of Article Views (full-text article views including HTML views, PDF and ePub downloads, according to the available data) and Abstracts Views on Vision4Press platform.
Data correspond to usage on the plateform after 2015. The current usage metrics is available 48-96 hours after online publication and is updated daily on week days.
Initial download of the metrics may take a while.