Fig. 4
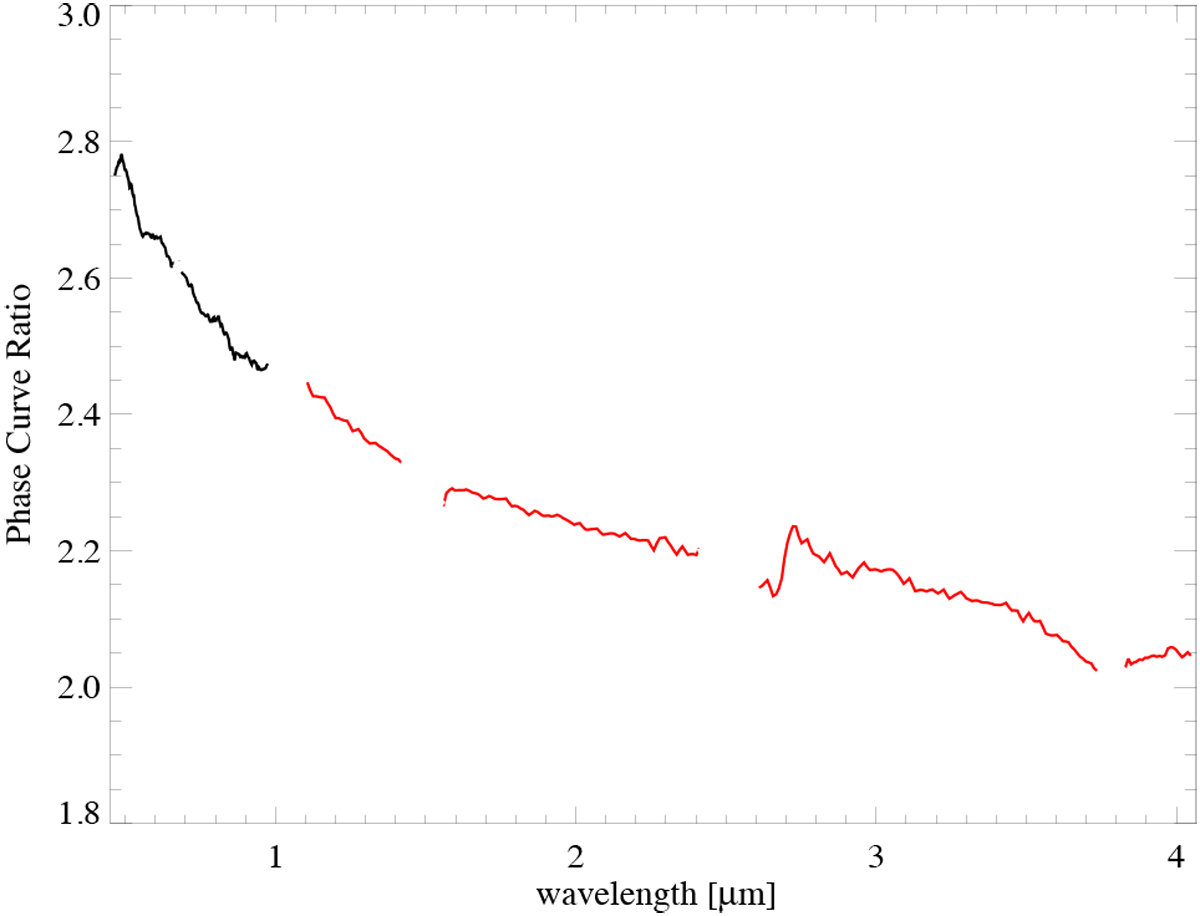
Ratio between Ceres’ phase curve at α = 20° and α = 80° (Phase Curve Ratio) against wavelength (VIS: black, IR: red). Gaps in the spectrum correspond to the order-sorting filter positions and VIS-IR junction of the instrument. We limit our analysis to λ > 0.465 μm because of increasing instrumental noise at the shortest wavelengths and λ < 4.065 μm because of the contribution of the thermal emission longward of this value.
Current usage metrics show cumulative count of Article Views (full-text article views including HTML views, PDF and ePub downloads, according to the available data) and Abstracts Views on Vision4Press platform.
Data correspond to usage on the plateform after 2015. The current usage metrics is available 48-96 hours after online publication and is updated daily on week days.
Initial download of the metrics may take a while.